With the federal government’s general commitment to increased diversity in appointments, and Justice Minister Jody Wilson-Raybould’s current review of the judicial appointment process, there needs to be a baseline of information about the current diversity situation in order to measure implementation of these commitments.
Overall, women, visible minorities and Indigenous people are under-represented among the over 1,000 federally appointed judges (65 are in federal courts, the balance are in provincial courts). There is a similar but less pronounced pattern of under-representation among the over 700 provincially appointed judges.
Does this matter given that judges by are expected to be objective, impartial and neutral? Their legal education, training and experience prepare them for this end. However, judges are human and, like all of us, they are influenced by their past experiences, influences and backgrounds. We know from Daniel Kahneman (author of Thinking, Fast and Slow) and others that no one is completely neutral and bias-free, even if the judicial process does represent “slow” or deliberative thinking, and thus greater objectivity, rather than “fast” or automatic thinking. Diversity of background and experience is another way to improve neutrality in decision-making.
Moreover, given the over-representation of some groups who are tried in the courts, such as Black people and Indigenous people, a judiciary in which these groups are significantly under-represented risks being viewed as illegitimate to those communities. The current debate over murdered and missing Indigenous women and police carding practices exemplify this risk.
Figure 1 highlights the extent of this under-representation: there are no visible minority or Indigenous judges in the Supreme Court and Court of Appeal, no visible minority judges in the Federal Court and no Indigenous judges in the Tax Court. In all the courts except for the Supreme Court, women are significantly under-represented.
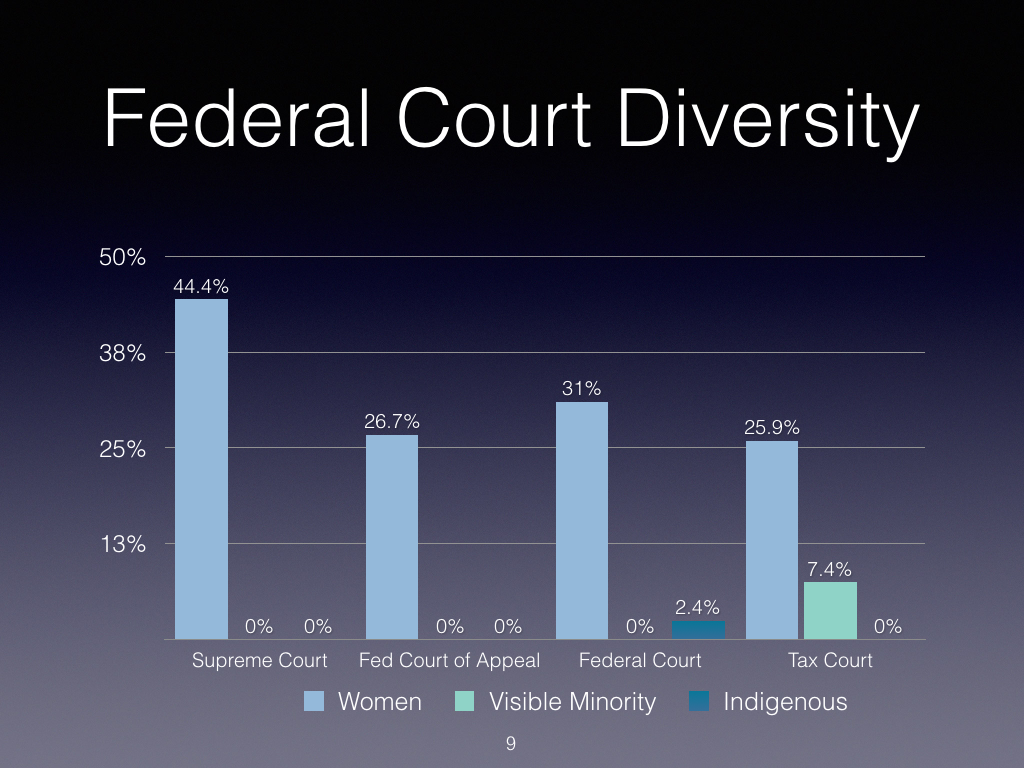
Figure 1
If we look at federally appointed judges to provincial courts (figure 2), the picture is slightly better in terms of both visible minority and Indigenous judges, but in both cases the representation is significantly lower than these groups’ population shares. In the superior courts/Queen’s Bench women are particularly under-represented, but they are better represented when the representation is compared with that of the federal courts.
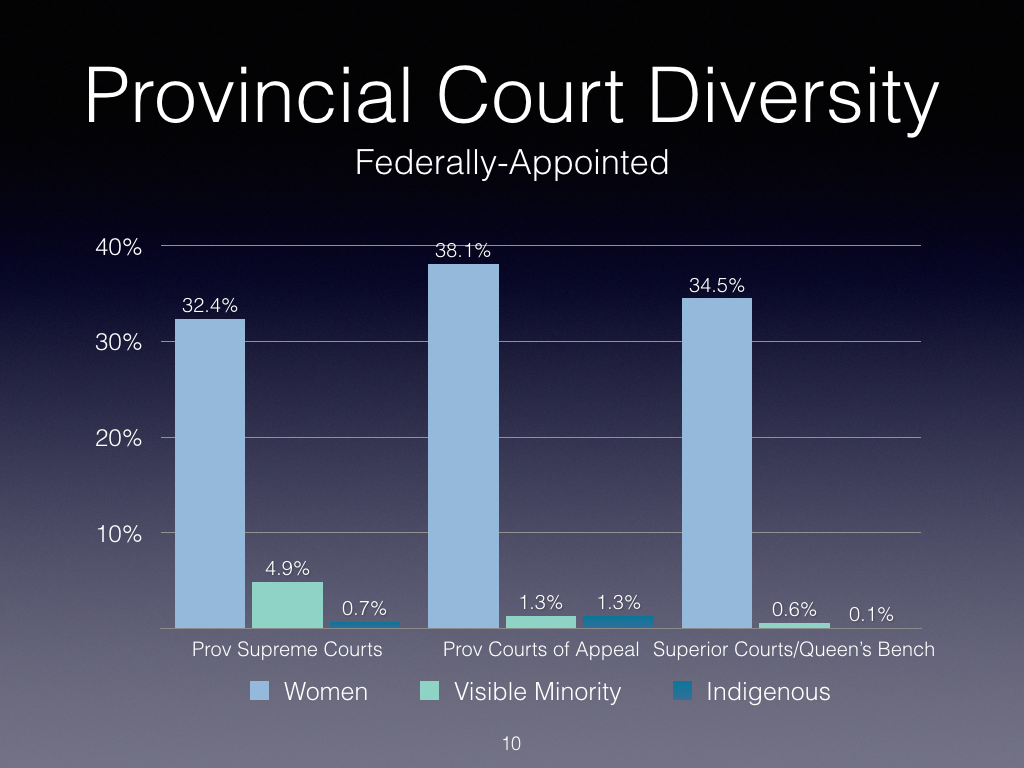
Figure 2
The picture for provincially nominated judges to provincial and territorial courts (figure 3) varies by province, but overall the provinces resemble each other in their under-representation of these groups. The Atlantic provinces, with the exception of Nova Scotia, have no visible minority or Indigenous judges. In the North, despite the large Indigenous population, there are no Indigenous judges. Quebec has relatively few visible minority judges and no Indigenous judges. Saskatchewan and Manitoba, despite their large Indigenous populations, have relatively few Indigenous judges.
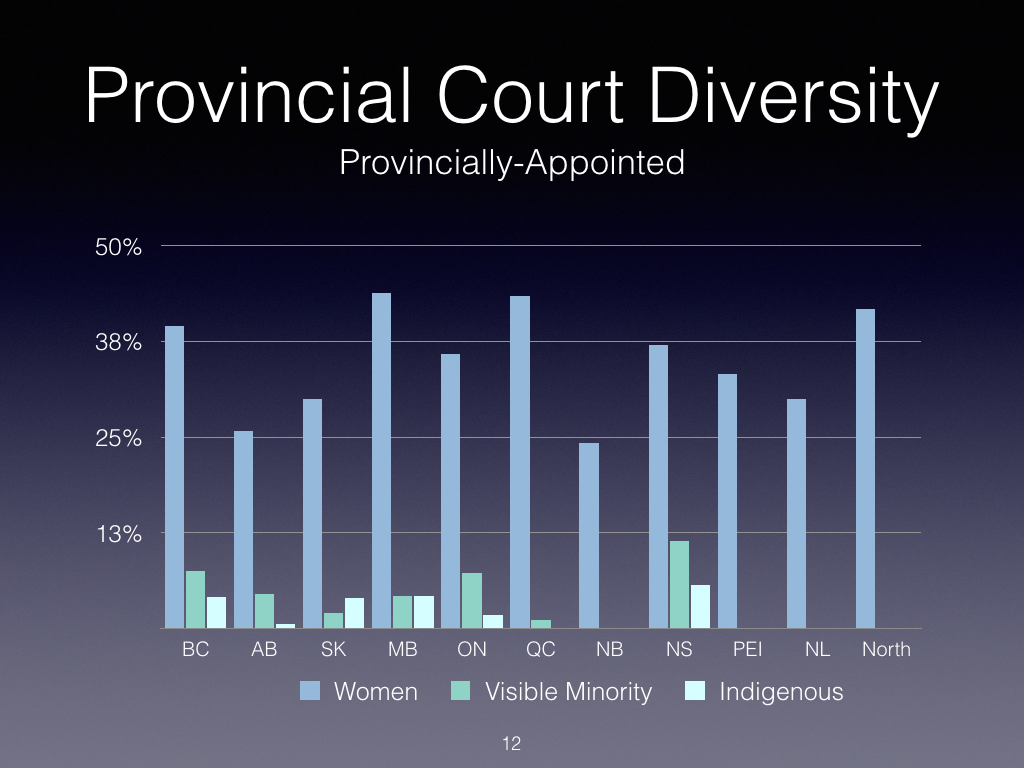
Figure 3
In the next series of charts federally and provincially appointed judges are compared for each under-represented group, by province, starting with women (figure 4). Here there is no overall trend: the federal and provincial appointment of women is similar in British Columbia, Manitoba, Nova Scotia, and Newfoundland and Labrador; in Saskatchewan, Quebec, Prince Edward Island and the North, provincial appointment of women is higher; and in Alberta the appointment of women is significantly lower, given the relatively large share of part-time and supernumerary appointments that are men (about a third of full-time judges are women).
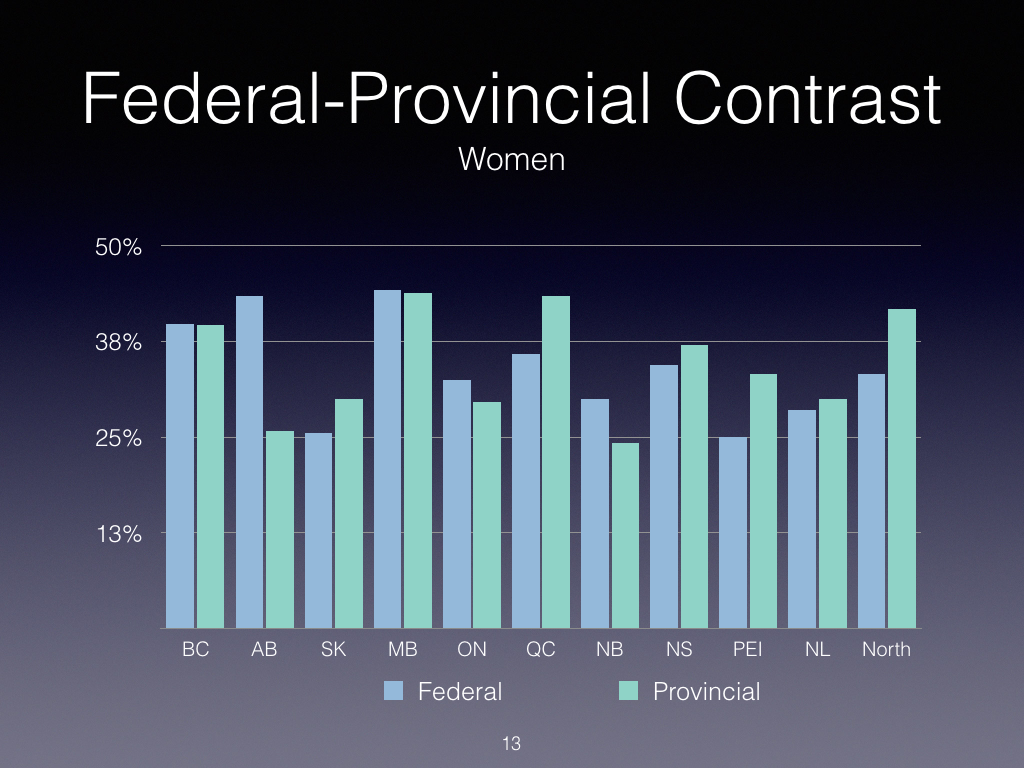
Figure 4
Looking at visible minorities (figure 5), when we compare federal and provincial appointments by province, we see a trend in all provinces except Saskatchewan: provincial judicial appointments are more representative of their populations than federal nominations, although visible minorities are still significantly under-represented.
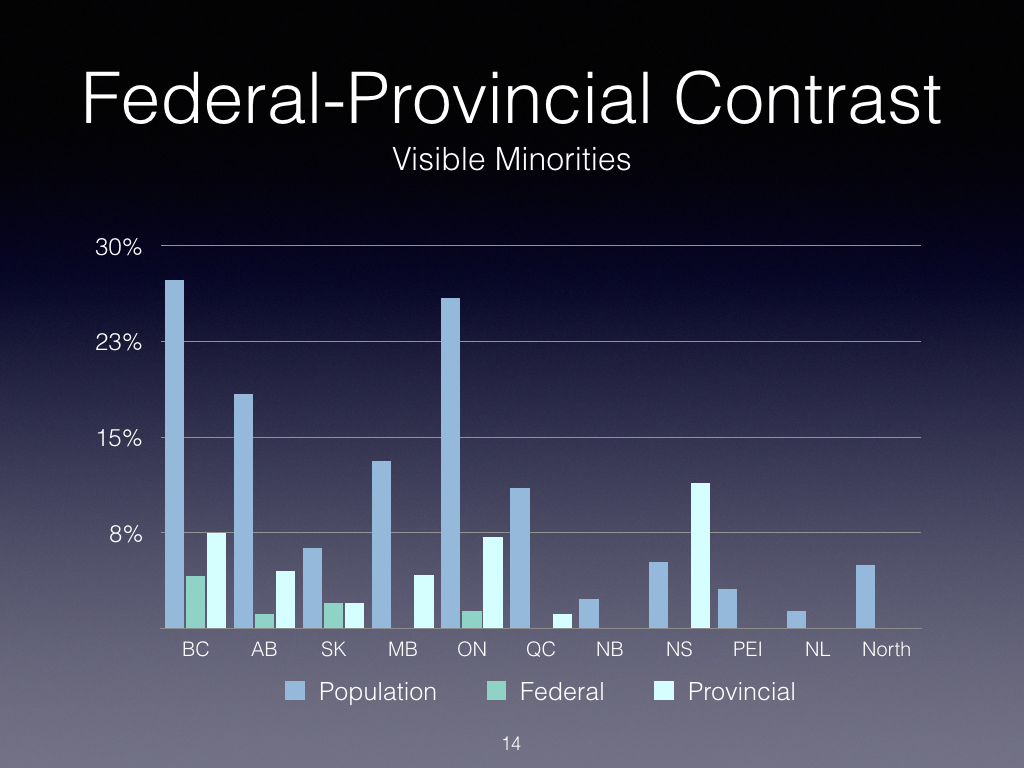
Figure 5
Lastly, with respect to Indigenous appointments (figure 6), we see the same pattern: provincial appointments are more representative of provincial populations than federal appointments in all provinces and territories, except, surprisingly, in the North, where there are no Indigenous territorial judges.
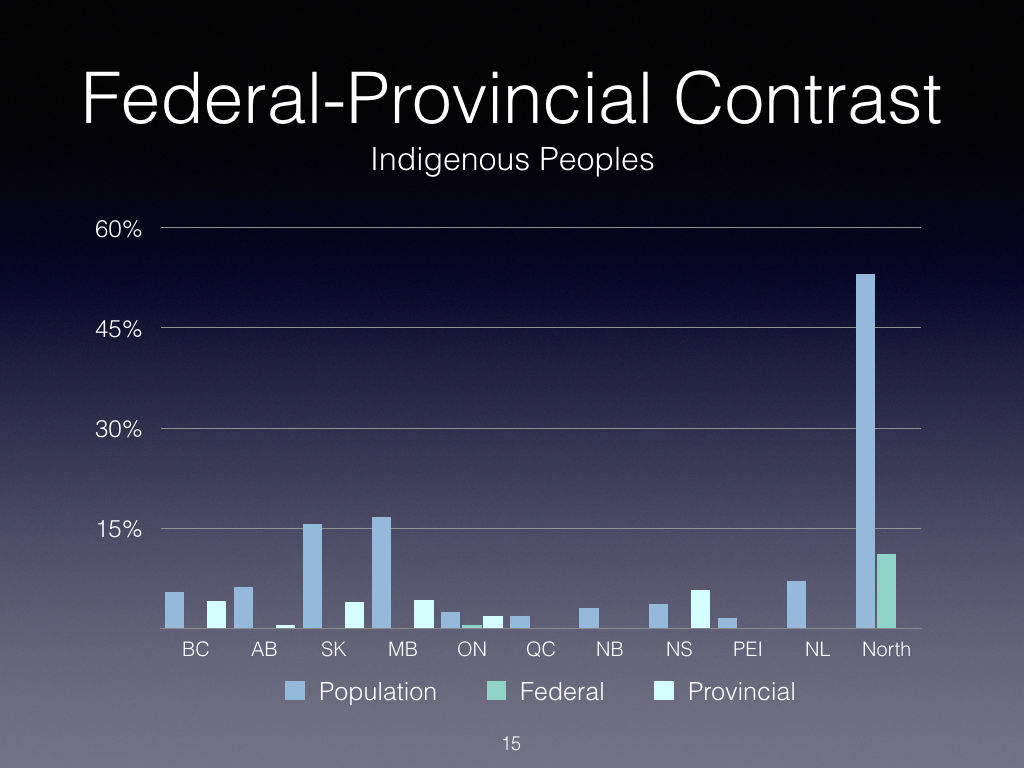
Figure 6
Looking at senior judges (chief and associate-chief justices), there are no federally appointed visible minority or Indigenous judges, and there are only a handful number of provincially appointed senior judges (figure 7).
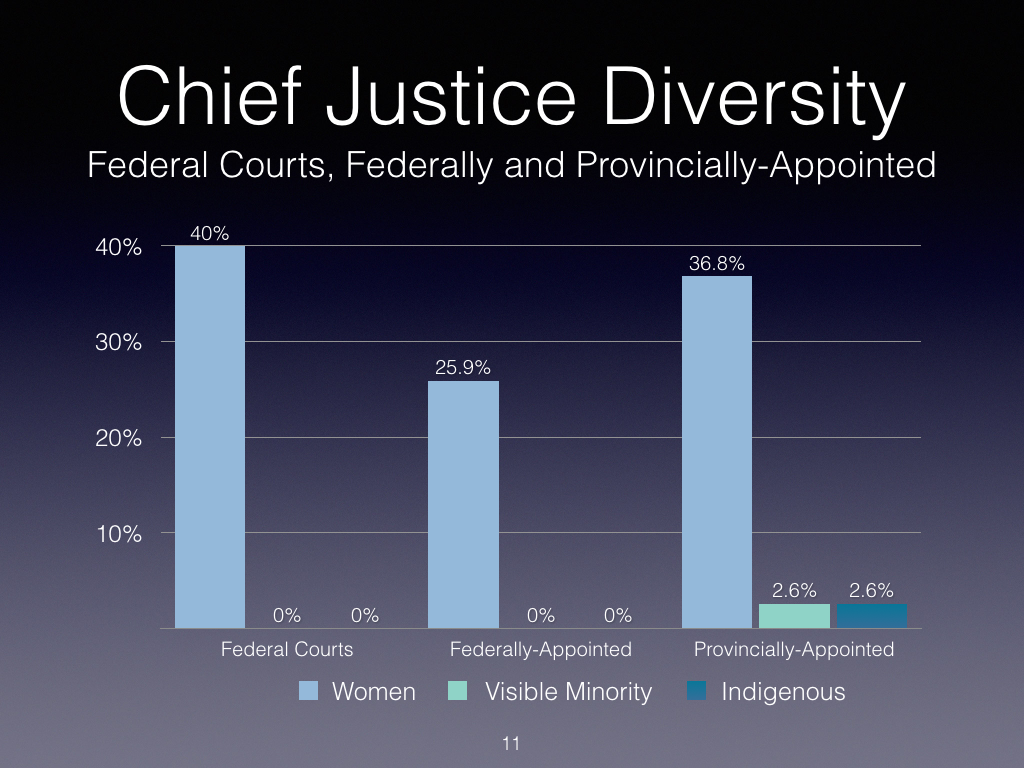
Figure 7
While judicial diversity is low, particularly for visible minorities and Indigenous people, the number of visible minority lawyers continues to increase. Figure 8 presents the proportions of visible minority lawyers aged 25-64 Canada-wide and in the largest provinces, which gives an idea of the size of the pool that can be drawn from. Given that visible minorities are, in general, younger than the general population, visible minority lawyers are also likely to be younger and, therefore, the percentage who would be aged 45 years old or older, the usual age people are considered for these positions, would be lower.
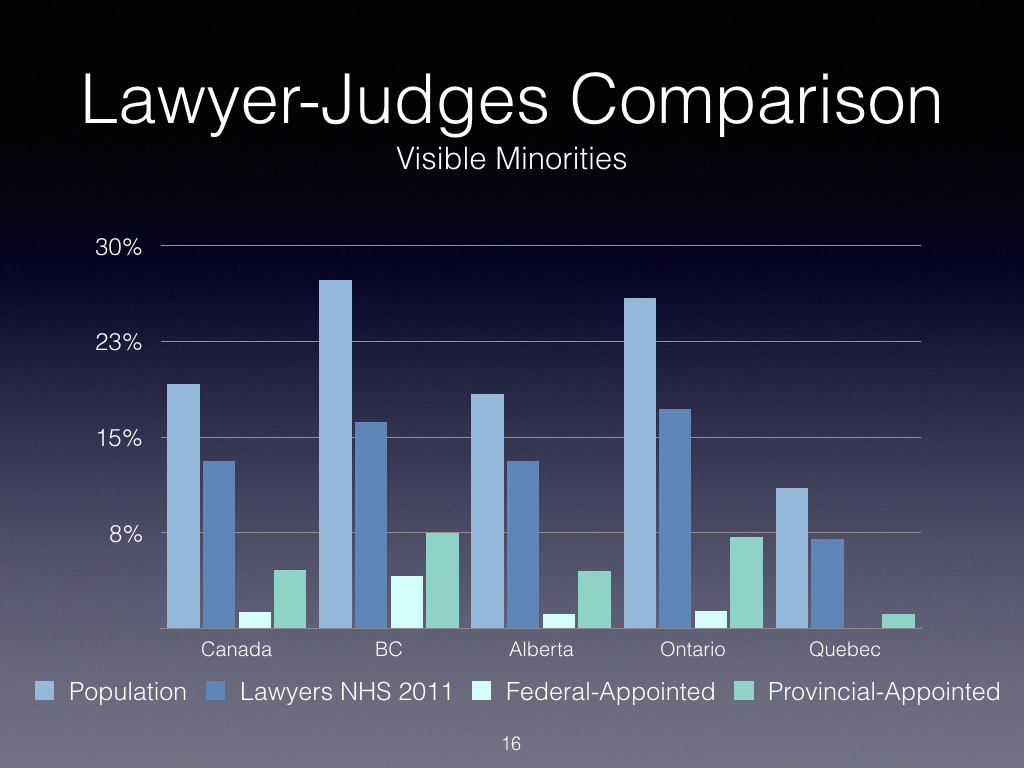
Figure 8
As part of its review of the judicial appointment process, the Office of the Commissioner for Federal Judicial Affairs should expand the existing information on the gender of judges and include visible minorities and Indigenous people. With this information, the government could be held to account for its diversity and inclusion commitments, and it would be easier to track its progress over time.
The provinces and territories that do not already do this should do so, and they should use Ontario’s annual reports on appointments as a model, ensuring that the annual reports cover the overall diversity of the entire bench.
*A few notes on methodology. The federal government publishes statistics on gender but not on visible minority or Indigenous appointments. All provinces except Alberta and Saskatchewan indicate gender through the use of “Mr.” or “Madam” justice (the departments of justice provided the number of women judges). Gender information is thus complete.
To identify visible minority and Indigenous origin name checks, appointment announcements and, when available, photos and biographies were used. All provincial judicial councils or departments of justice were approached (only Ontario reports publicly but Saskatchewan, Quebec and Nova Scotia provided the breakdowns used). The Canadian Bar Association, national and regional branches, and law societies were approached and a number of individual lawyers also helped improve the quality of the data collected. I believe this provides a reasonable assessment of current diversity.
Photo: Art Babych / Shutterstock.com
Do you have something to say about the article you just read? Be part of the Policy Options discussion, and send in your own submission. Here is a link on how to do it. | Souhaitez-vous réagir à cet article ? Joignez-vous aux débats d’Options politiques et soumettez-nous votre texte en suivant ces directives.