In January, as part of the federal government’s emissions reduction program, Environment and Climate Change Canada announced that it would be imposing a carbon pricing system on any province that does not have an acceptable carbon pricing program of its own by September.
The system consists of two parts: a carbon levy on carbon-based fuels, the cost of which will be passed on to anyone purchasing these fuels, and an output-based pricing system (OBPS) for industries with emissions exceeding 50,000 tonnes of CO2e (carbon-dioxide equivalent) a year.
Each industrial emitter is expected to meet an annual output-based emissions limit; exceeding the limit results in a fine starting at $10 per tonne of emissions in 2018 and increasing by $10 per tonne each year until 2022. Since the limit is reduced each year, the program is intended to result in incremental declines in industrial emissions. The metric used to determine the limit is emissions intensity.
Emissions intensity is a ratio of the quantity of emissions (usually CO2e) to the output of a specific activity, such as tonnes of CO2e per tonne of steel produced or per megawatt-hour of electricity generated, or to a broader indicator such as GDP.
When emissions intensity improves over time, the value of the ratio declines. Ideally, this means the emissions side of the ratio declines and the activity side increases, remains constant or declines more slowly than emissions. However, this is not always the case.
Figure 1 shows changes in emissions intensity, measuring CO2e emitted per dollar of GDP, for three provinces between 2005 and 2015. During this time the emissions intensity of each province improved — that is, the ratios declined: Alberta’s went down by 8.6 percent, Quebec’s by 21.3 percent and Nova Scotia’s by 35.8 percent.
But since emissions intensity is a ratio, a province’s emissions intensity alone gives no indication of the values on either side of the ratio: the quantity of emissions and the quantity of the activity or indicator being measured against. For example, a decline in emissions intensity from one year to another may be the result of emissions increasing while GDP increases at a faster rate.
This shortcoming becomes clear when the annual changes in emissions and the activity used to calculate intensity are plotted separately, relative to a base year. Figure 2 shows changes to emissions and changes to GDP in each of the three provinces, relative to 2005.
This figure shows why Alberta’s emissions intensity went down between 2005 and 2015 even though its actual emissions went up: its economic growth increased at a faster rate than its emissions growth, as a direct result of the rising price of crude oil and the province’s construction boom. Increases in emissions intensity were caused when emissions grew faster than GDP (2006-07) or when the decline in emissions was not as great as the decline in GDP (2008-09 and 2014-15).
There was a different reason for the decline in Quebec’s emissions intensity. As figure 2 shows, Quebec’s emissions declined and its GDP increased. Decisions to reduce reliance on oil for space heating and to close the Shell refinery in Montreal both contributed to the decline in emissions.
Nova Scotia experienced the largest percentage decline in emissions intensity of any Canadian province. Figure 2 indicates why: a large decline in emissions and weak economic growth. About half of the decline in emissions was the result of replacing coal with natural gas and renewables for electrical generation. The other half reflected changes in the province’s GDP: the closure of paper mills, a weakening of the manufacturing sector, a decline in transport energy demand and the closure of the province’s refinery.
These three provinces illustrate some of the possible outcomes of the federal government’s output-based pricing system.
Industrial emitters that can reduce their emissions without affecting their activity will, like Quebec, reduce their emissions intensity. These industries should be unaffected by their OBPS limits.
If an industrial emitter is unable to reduce its emissions without affecting the level of its activity, a decline in emissions may improve its emissions intensity. But if the activity shows little growth or even declines, as in the case of Nova Scotia, the industry and its employees may be adversely affected. If achieving its OBPS limit results in the downsizing or closure of the industry, provisions may be needed to assist those affected.
Finally, as Alberta has shown, an industrial emitter can increase its emissions but still meet its OBPS limit. While this may be good for the economy, it is not reducing Canada’s emissions.
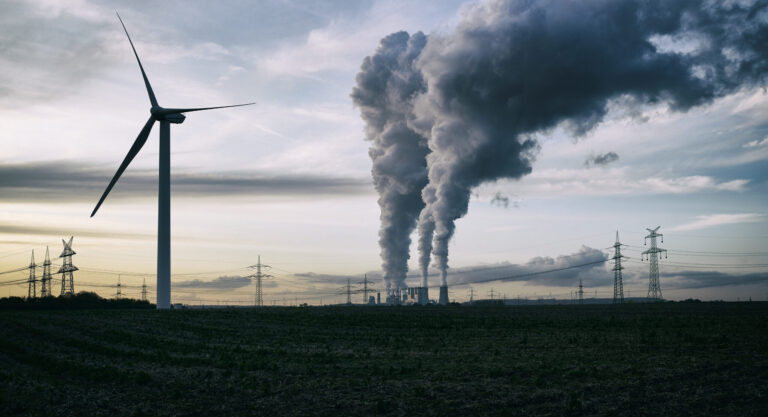
Photo: Shutterstock, by Lisa S.
Do you have something to say about the article you just read? Be part of the Policy Options discussion, and send in your own submission. Here is a link on how to do it. | Souhaitez-vous réagir à cet article ? Joignez-vous aux débats d’Options politiques et soumettez-nous votre texte en suivant ces directives.