In recent decades, lower trade costs and technological innovations have allowed companies to split their production processes into different stages and perform them in different countries. As a result, world trade and production have become increasingly structured around “global value chains” (GVCs), which are especially prevalent in high-tech industries such as electronics, motor vehicles and other manufacturing as well as apparel.
Until recently, GVC analysis was often limited to specific case studies (e.g., production of the iPhone) or business surveys. But with new value-added trade data (based on global input-output tables) the extent to which production is fragmented across countries can now be assessed for individual countries and major trading regions. This approach is providing a more accurate picture of who trades what, and with whom. Here are some highlights from our new chapter, written by OECD researchers Koen De Backer and Sébastien Miroudot, that explains these broader global trends, with a focus on Canada.
The globalization of production
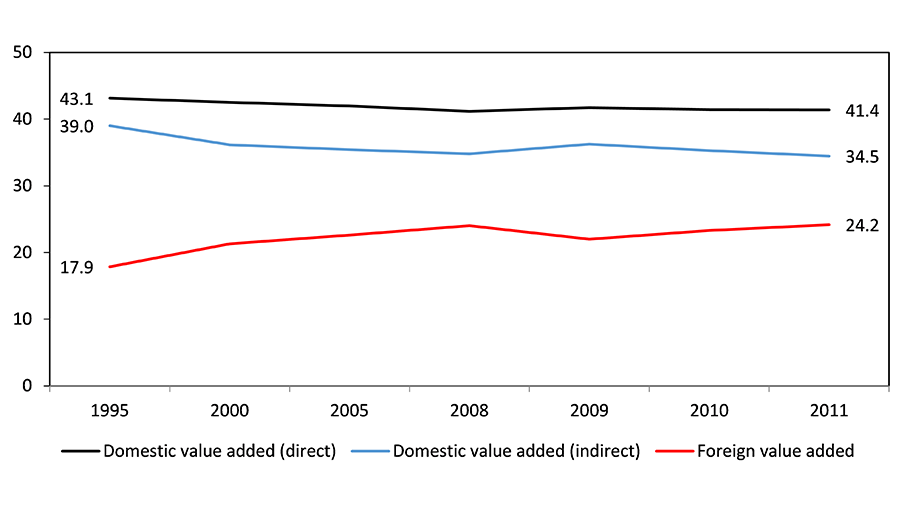
The value of gross exports of goods and services from 1995 to 2011 (the period covered in the newly-updated OECD-WTO Trade in Value-Added, TiVA database) can be decomposed into three parts:
- direct domestic value added, which comes from the exporting industry itself (e.g., the value added by car manufacturers in the exports of cars, including wages paid in production);
- indirect domestic value added, which comes from domestic inputs purchased by the exporter (including from the same industry — such as car parts bought by the car manufacturer — as well as from other industries, such as business services or chemicals purchased by the car exporter);
- foreign value added, which comes from outside the exporting country (e.g., foreign car parts).
International sourcing, through independent suppliers and own affiliates, has increased in recent decades, with the share of foreign inputs rising from 18 percent in 1995 to 24 percent in 2011 (figure 1).
Figure 1: World gross exports by share of domestic and foreign value added, 1995-2011
(percent)
 Example of value chains
In practice, production processes can involve a mix of value chain dynamics, including:
- producer-driven chains: where large high-tech firms control product design and assembly, and produce in-house (or in affiliates) to prevent competitors from using new technologies and know-how.
- Examples: electronics, autos and pharmaceuticals.
- buyer-driven value chains: where large retailers and successful brand merchandisers act as “lead firms” that focus on sales and marketing, while outsourcing production.
- Example: apparel industry
- snake chains: follow the classical assembly line process, where each stage in the sequence further transforms the product.
- Examples: basic metals, textiles, wood and electrical machinery.
- spider chains: involve the simultaneous assembly of several separately produced intermediates into one final good or service.
- Example: banking, where financial hubs are located in different countries, but the end service is delivered in a single stage in the consumer’s country.
Regional interdependencies
GVCs can be considered regional in nature, structured around “Factory Asia”, “Factory North America” and “Factory Europe”. But with changing regional dynamics, they’re increasingly becoming global in scope. The share of value-added in gross exports coming from outside these regions has increased and the share from inside the region has fallen (figure 2).
Figure 2: Sources of the shares of foreign value added in gross exports, 1995 and 2011
(percent)
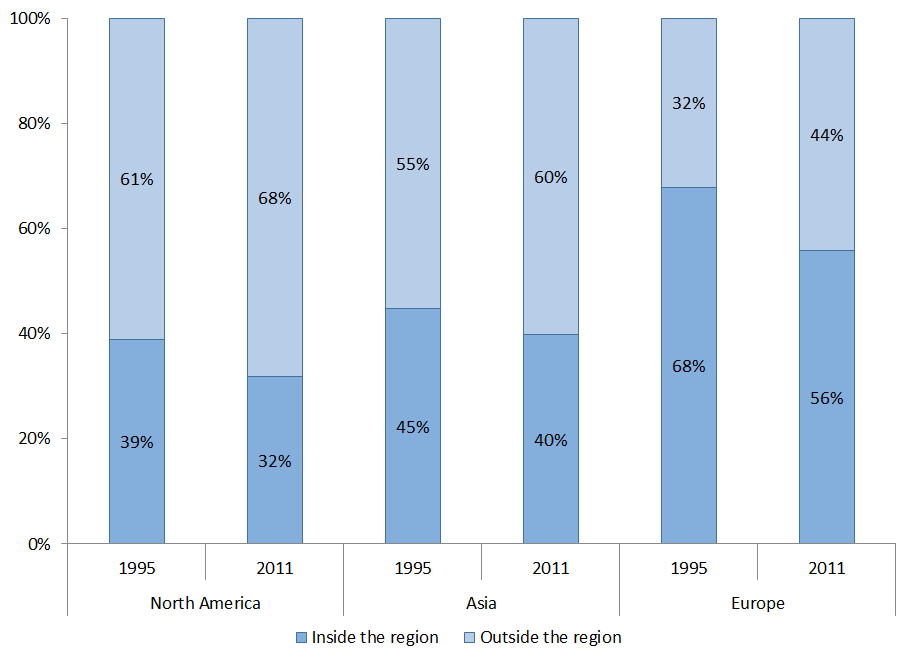
- NAFTA countries collectively source less than one-third of their foreign inputs in value-added terms from among them. (If that number seems too low, it primarily reflects by the dominance of US trade patterns in continental trade).
- In Asia, only 40 percent of the intermediates embodied in exports are sourced from within the region. (Here, a significant share of parts and components produced by developed economies such as Japan and South Korea are exported to emerging economies — particularly China and, increasingly, Vietnam and Cambodia — where the inputs are assembled into finished products.)
- Perhaps not surprisingly, Europe has the most sourcing from within its region due to its more highly-integrated and geographically-concentrated market.
New technologies, such as 3D printing, are expected to continue to reshape GVCs in the future and reduce the importance of distance as a factor explaining the location of suppliers.
Country level differences
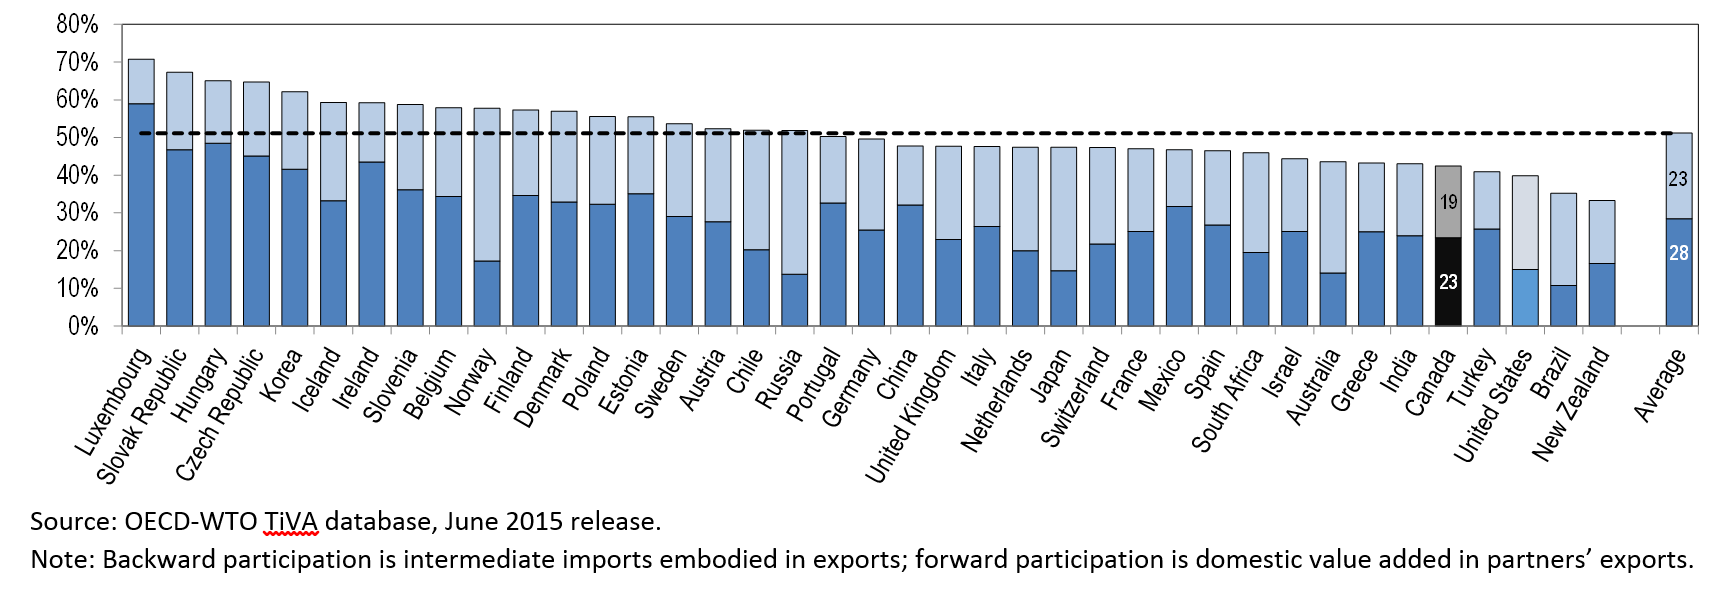
The authors use a rich dataset covering 39 advanced and key emerging market countries. The results show that countries differ greatly in the share of foreign value added in their gross exports, related to such factors as the size of their economy, natural resource endowments, patterns of specialization and geography (figure 3).
Figure 3. Share of foreign value added in gross exports, selected countries, 1995 and 2011
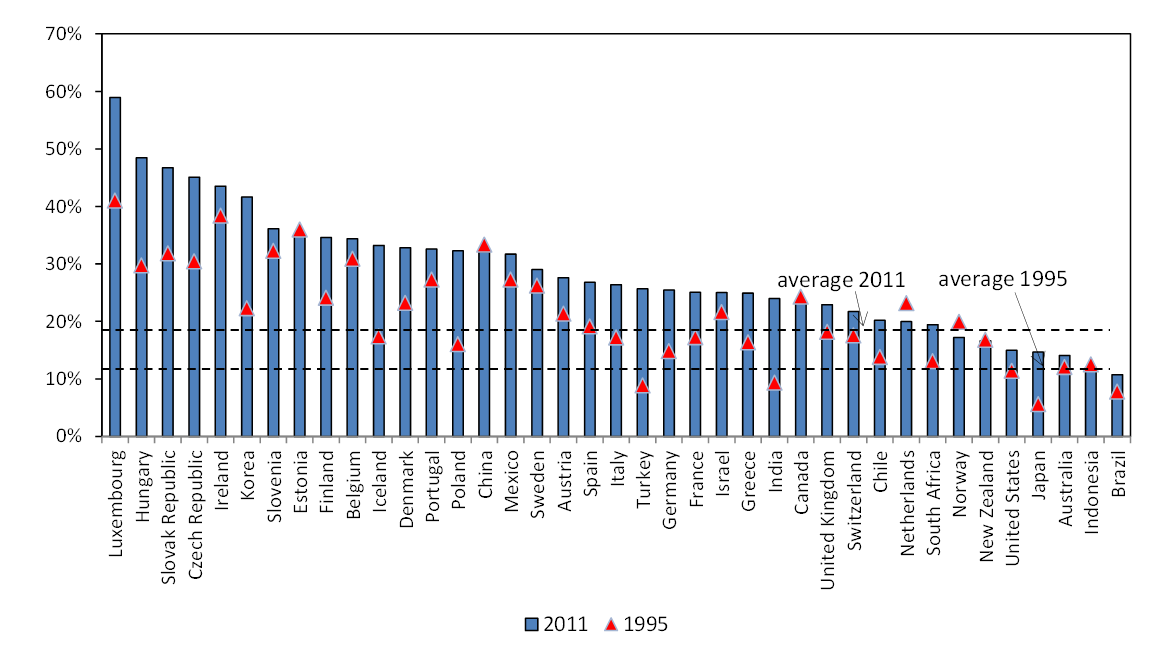
- Small economies (e.g. Luxembourg) have limited ability to draw on domestic sources of inputs, so they tend to have higher shares of foreign value added embodied in their exports.
- Large economies (US and Japan) have a wider variety of domestically sourced intermediate goods available, and thus rely less on foreign imports of intermediates.
- Countries with substantial natural resources (Australia, Norway and Canada) have lower ratios of foreign value added in exports, as mining activities require fewer intermediate goods in the production process.
- Finally, due to higher trade costs, countries that are located farther away from markets and suppliers (New Zealand, South Africa and Indonesia) also tend to use fewer foreign inputs in their exports.
Where does Canada fit in?
Countries participate in GVCs both as users of foreign inputs and as suppliers of intermediate goods and services used in other countries’ exports. The GVC participation index measures the share of a country’s exports that are part of GVCs due either to backward links (looking back in the value chain and estimating the foreign value added contained in a country’s exports) or to forward links (looking ahead and measuring the domestic value added contained in other countries’ exports).
In 1995, Canada’s overall GVC participation score, at 35 percent, was only slightly below the sample average of 38 percent (figure 4). By 2011, however, although Canada’s overall score had increased to 42 percent, the average had increased even more, to 51 percent. Also notice that both the US and Mexico also slid down the ranks too, which demonstrates the NAFTA countries more generally have failed to keep pace with the stronger GVC developments in Asia and Eastern Europe.
Figure 4: Global value chain participation index
1995
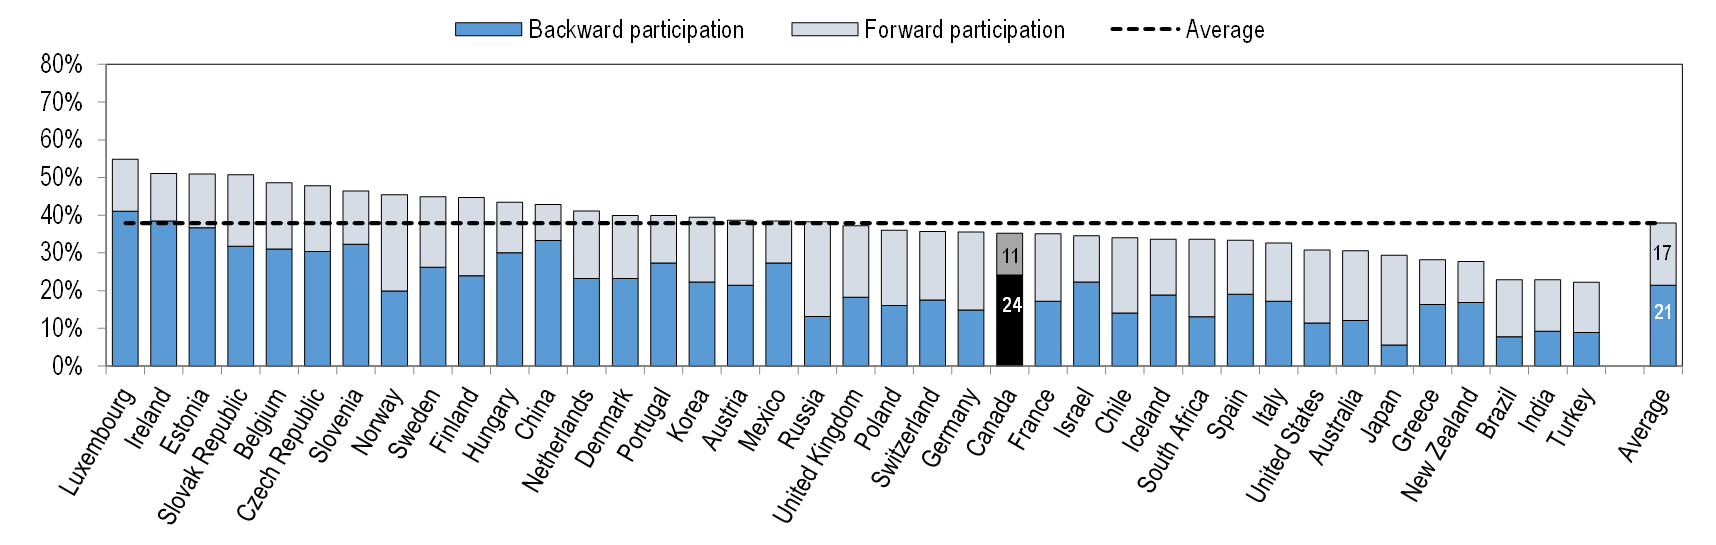 2011
2011
 Breaking down Canada’s results into their two components, backward and forward participation, the country’s backward participation score — the foreign content in its exports — was essentially stable over the 1995-2011 period, even as other countries increasingly were using imports to produce their exports. This difference might reflect, in part, the relatively mature value chains that already existed between Canada and the US in the mid-1990s related to the implementation of the Auto Pact in 1965 and the Canada-US FTA in 1989.
In contrast, Canada’s forward GVC participation score started out well below the sample average in 1995, perhaps related to the fact that the US is the first and final destination for a large share of Canada’s exports.
By 2011, Canada had made up some of the gap — due in part to sectoral shifts away from exports of motor vehicles and toward natural resources and mining activities, which are more often exported subsequently to third countries. Indeed, Canada’s GVC participation varies quite substantially across industries. In 2011, mining had the highest forward GVC participation score, reflecting the later use in value chains of Canada’s natural resources in the exports of other countries. In contrast, manufacturing industries — particularly motor vehicles, due to integrated North American supply chains, and basic metals — show higher backward participation scores, since they use significant foreign intermediates in their exports.
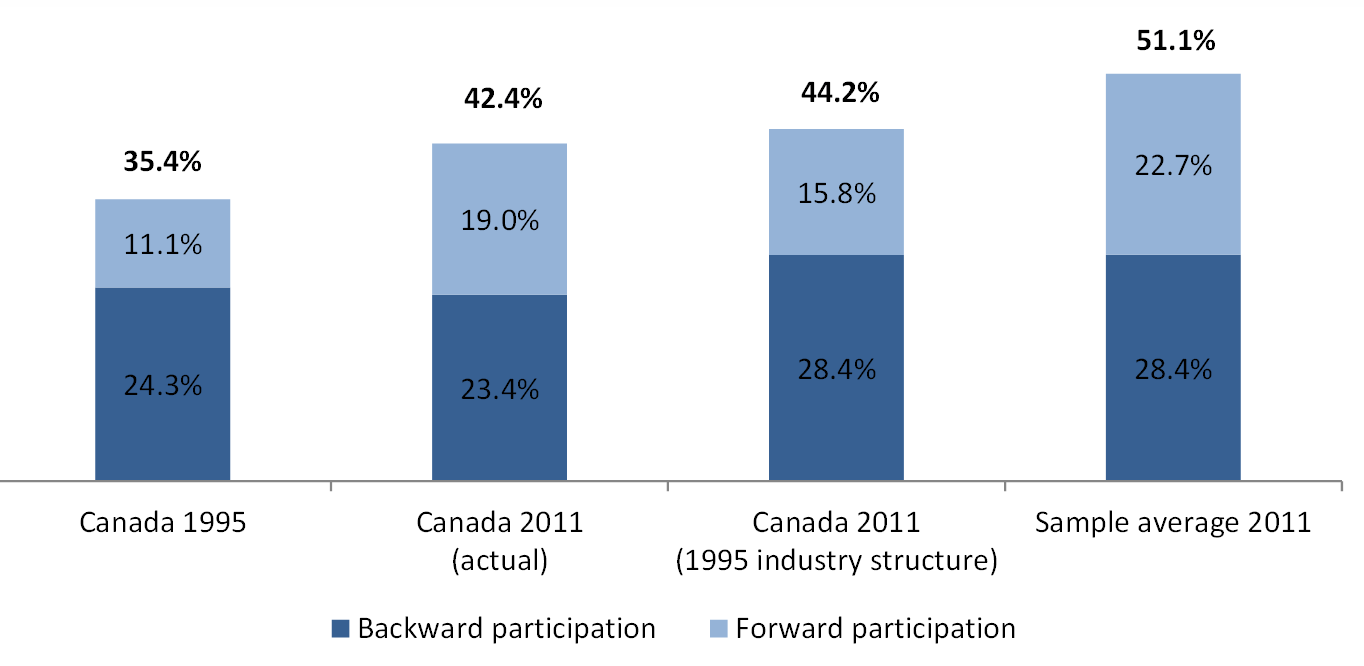
A key — and perhaps surprising — finding of the chapter is that the large changes in the industrial composition of Canada’s exports had only a minor impact on its overall GVC participation (although it affected the relative importance of the backward and forward participation scores).
The authors found this by holding the weight of each industry constant in total exports and superimposing the 1995 composition on the 2011 results. Had there been no industrial change over this period, Canada’s total GVC participation rate would have been slightly higher in 2011: 44 percent, rather than the 42 percent observed, but would still remain well below the average.
Figure 5: Canada’s global value chain participation, with and without industrial change
 In addition, the overall foreign content of Canada’s motor vehicle exports increased between 1995 and 2011; and there were also notable changes in the origin of our foreign inputs (table 1).
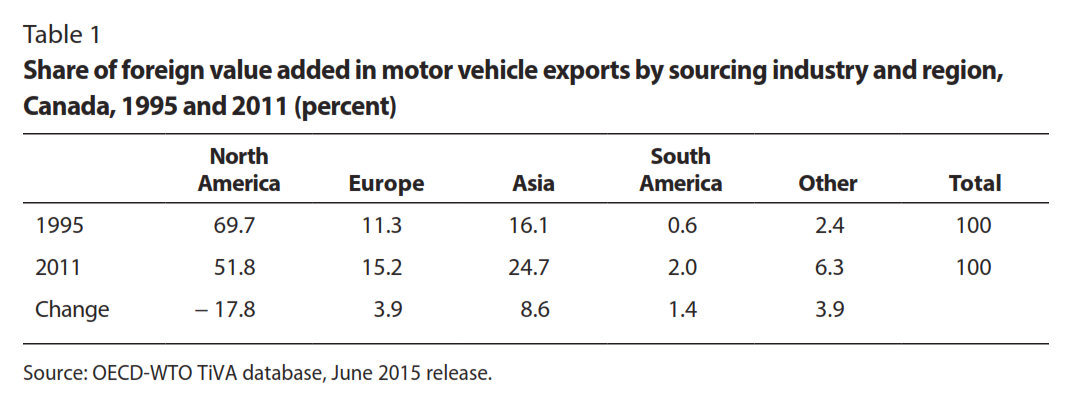 The shares of North American suppliers fell significantly, while Asian and European suppliers made considerable gains. This trend reflects the greater fragmentation of value chains for transportation equipment, but also suggests changes in the relative positioning of Canada’s automotive industry within these chains.
Policy implications
Given the importance of country-specific factors, there are few one-size-fits-all policy prescriptions, but the authors recommend several general policy directions based on their analysis:
- Interconnectedness among countries: Estimates suggest that, in 2011, just over one-quarter of total employment in OECD countries was being used to produce for final consumers in foreign markets. This highlights the potential for macroeconomic and policy spillovers, and for local supply disruptions to ripple through the global economy (e.g., 2011 earthquake and tsunami in Japan).
- In GVCs because countries are increasingly importing in order to export, tariffs and other barriers to intermediate imports effectively act as a “tax on exports” which raises production costs and inhibits a country’s ability to compete internationally.
- With goods crossing borders multiple times, as inputs and then as final products, fast and efficient customs and port procedures are essential to the smooth operation of supply chains.
- Convergence of international standards and mutual recognition agreements can help make it easier for SMEs to participate in the global economy.
Governments are looking for new ways to position economic activities in these global production networks with a view to safeguarding growth and employment at home. Defensive policies to protect domestic companies can be counterproductive. Instead, the focus should be on strengthening production factors that are “sticky” and less likely to cross borders. Relevant policies include investing in people and skills, high-quality infrastructure and encouraging strong industry-university linkages and forms of tacit knowledge. The quality of institutions and government also plays a role, and can be a major factor in firms’ decisions to invest in a country. In addition, policies should help ease adjustment costs for workers struggling with transitions to retool and find new jobs.
Finally, GVCs are the heart of the discussion on the future of manufacturing in developed economies. Thus far, OECD countries seem to have specialized more in upstream activities, where the most value is often created, such as R&D, design, marketing, branding or customer service, while emerging economies specialize more in manufacturing and assembly.
Conclusions
New evidence from the OECD/WTO Trade in Value-Added database shows that production processes and networks have become increasingly international in recent decades. Firms now often import in order to export, and so the share of foreign value added in gross exports has increased, as GVCs are becoming longer and more sophisticated. At the same time, services play a larger role in value chains than conveyed by conventional gross trade statistics.
Canada has increased its overall participation in GVCs over the past two decades, but not by as much as other parts of the world — particularly Asia and Eastern Europe — which partly reflects Canada’s relatively mature trade linkages with the United States, already well established by the mid-1990s.
Canada’s exports have also shifted away from manufacturing and motor vehicles and toward resources and mining, which are less reliant on foreign content. Importantly, however, this shift had only a minor impact on Canada’s overall GVC participation, and the strong rise in the prices of natural resources over the 1995-2011 period does not, on its own, seem to explain why Canada is falling behind other countries.
Changes are underway in the positioning of Canada auto sector within the value chain, and compared with other OECD countries. Canada has a lower-than-average services content in its exports in most industries — particularly in business services, where there seems to be considerable room for growth.
The authors’ findings underscore the interconnected nature of the global economy and Canada’s role in it, and dependence on it. Nearly one-fifth of all employment in Canada (roughly 3.5 million jobs) is devoted to producing goods and services for foreign consumers, and about 75 percent of the value-added exports associated with these jobs is attributable to North American consumers (roughly 2.5 million jobs).
In this context of increasingly interrelated imports and exports, protectionist policies are ultimately counterproductive. For Canadian policy-makers looking to boost jobs and growth in the domestic market, the policy focus should be on strengthening production factors that are less likely to cross borders. High-value-added activities such as R&D, product design and customer service are particularly attractive. Over the long run, policies that focus on maintaining a highly skilled workforce and high-quality, trade-related infrastructure will help encourage international investment in, and trade with, Canada.
I encourage you to read the full chapter here, which is part of the IRPP’s forthcoming Canadian trade policy volume.