With the large number of Senate appointments made by Prime Minister Justin Trudeau and a more independent role for individual senators, a look at the current level of diversity in the Upper Chamber is timely.
In essence, the Trudeau appointments have made the Senate more diverse in terms of gender, visible minorities, and Indigenous peoples and thus more representative of the people it serves.
However, when viewed from the perspective of education and occupation, there is less diversity: more senators with higher degrees, and more senators with an activist background and less with a business background.
Given the increased independence of senators, the increased ethnic and gender diversity and decreased educational and occupational diversity may play a role in terms of how the Senate responds to legislation and plays its sober second thought role.
This analysis contrasts the various aspects of diversity between the 43 non-affiliated senators (33 form the Independent Senators Group, of whom 28 were appointed by Prime Minister Trudeau), and the 41 Conservative and 21 Liberal senators (December 2016).
A note about the methodology: I used a wide range of sources when compiling this analysis, including the National Household Survey, parliamentary websites, Senate and private biographies, and news articles. In terms of demographic data, visible minority status was determined by names, photos and biographies. For Indigenous status, ParlInfo provided the needed information. For persons with disabilities, biographies were used and both physical and learning disabilities were included.
Canadian diversity
As noted above, a fundamental premise is that political institutions, including the Senate, should be broadly representative of the population they serve. To provide context, this section provides an overview of Canadian diversity with respect to the main public service employment equity categories: women, visible minorities, Indigenous peoples, and persons with disabilities. Chart 1 provides an overview of the numbers of those who are not visible minority, visible minorities and Indigenous peoples.
CHART 1
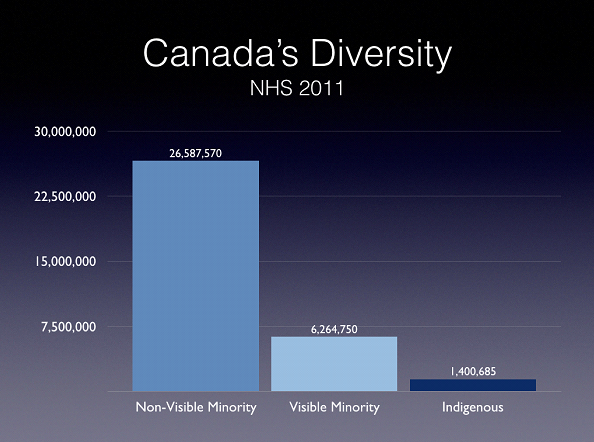
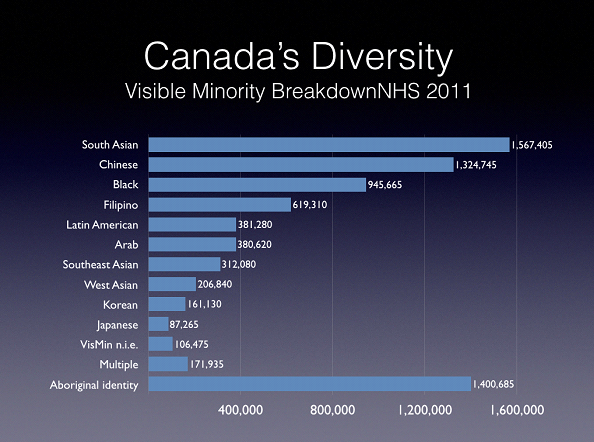
Chart 2 provides a breakdown of visible minorities, highlighting the three largest groups: South Asian, Chinese and Black, following relatively closely by Filipino.
CHART 2
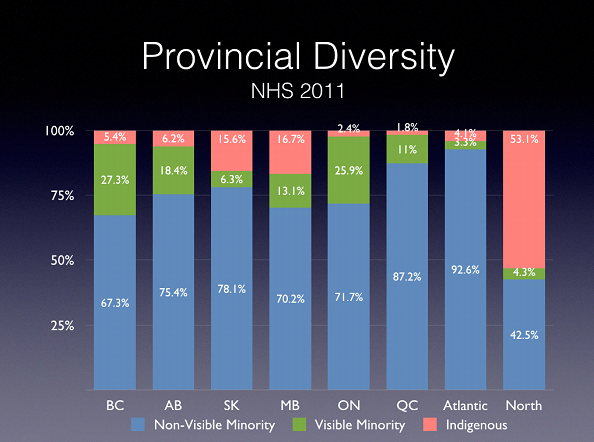
However, Canada’s diversity of varies from region to region. Chart 3 provides the provincial and territorial breakdown. British Columbia and Ontario are the most diverse in terms of visible minorities, with over a quarter of the population, followed by Alberta. Quebec has relatively few visible minorities, less than Manitoba. Indigenous peoples are concentrated in the North and the Prairie provinces of Saskatchewan and Manitoba.
CHART 3
Overall Diversity
Chart 4 looks at the overall diversity of the Senate versus the wider population, with the House of Commons included for comparison purposes. The Senate is closer to gender parity, at 40 percent women (42 senators) than is the House, of whose members just over a quarter are women. In both the Senate and in the Commons, the numbers of visible minority parliamentarians comes close to the 15 percent among all citizens. Indigenous representation in the Senate is twice as strong as in the House and greater than their share of the population, with 6 Indigenous senators. Only two senators have disabilities, but again, their share in the Senate is greater than that in the House.
CHART 4
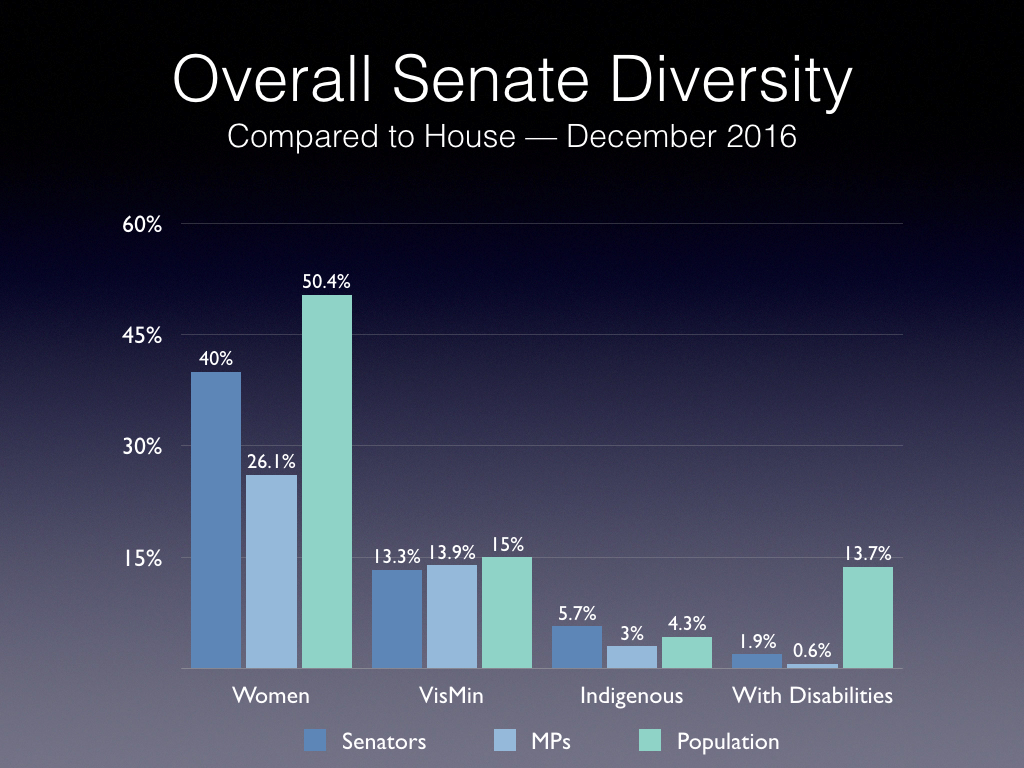
Chart 5 contrasts the overall representation by breaking this down by political affiliation. Not surprisingly, the 43 non-affiliated senators are the most diverse, largely reflecting the nature of the 28 appointments of the Trudeau government. However, the Harper government also made a conscious effort to appoint visible minority senators which form a significant percentage of their 40-member caucus. In contrast, the 21-member Liberal caucus, largely dating from the Jean Chrétien government, has the largest percentage of Indigenous senators.
CHART 5
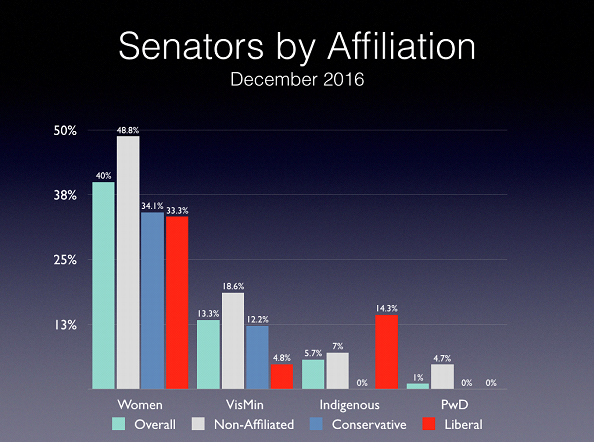
Chart 6 examines the number of immigrant senators, broken down by party affiliation, gender and visible minority. Overall, 15 immigrants sit in the Senate, 9 men and 6 women. Thirteen are from a visible minority. Three senators from the Caribbean (Barbados, Haiti and Jamaica), three are from South Asia (India, Pakistan), five are from elsewhere in Asia (Korea, Malaysia, Philippines, Singapore, Vietnam), two are from Europe (England, Greece), and one comes from Africa (Uganda) and one comes from Latin American (Peru). Not surprisingly, the percentage of visible minorities who are immigrants is extremely high in all groups.
CHART 6
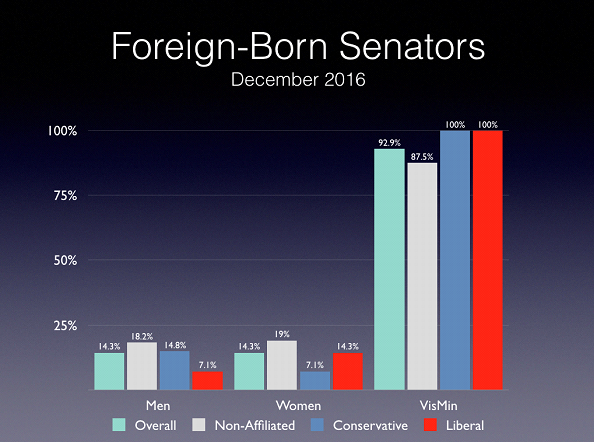
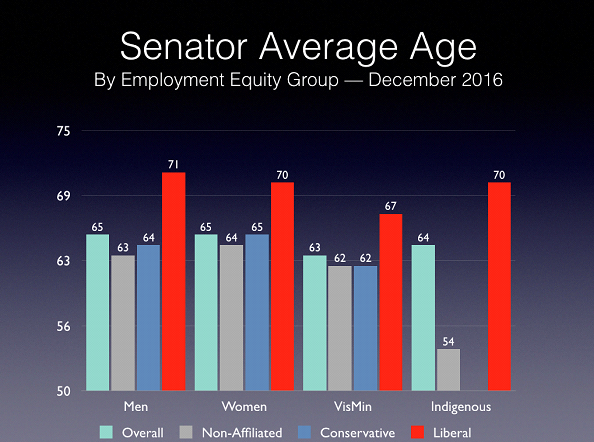
Chart 7 looks at the age profile of senators, again broken down by affiliation, gender and visible minority. As expected, senators appointed by previous Liberal governments (Martin, Chrétien) are older than more recent appointments by the Harper and Trudeau governments. There are minimal differences in age of these latter groups for men, women and visible minorities. Only non-affiliated Indigenous senators have an average aged significantly younger than other groups, larger due to Senator Brazeau (age 42). There is no information on the parliamentary website on the age senators were at the time of their appointment.
CHART 7
Education
Educational backgrounds vary considerably among senators. Starting with the highest level of education, chart 8 provides the overall numbers as well as by affiliation. Overall, about three-quarters of senators have a post-secondary education, mainly at the university level. This is slightly higher than the 64.1 percent of working age (25-64) Canadians with post-secondary education. However, this overall number understates the degree to which senators are more educated than Canadians: 8.6 percent of senators have PhDs, compared with 0.9 percent of the population; 22.7 percent have an MA/MSc compared with 5.1 percent of the population; and 36.2 percent have a BA/BSc, compared with 16.5 percent of the population. Conversely, there is underrepresentation of those with a college diploma (6.7 percent, compared with 21.3 percent of the population), and those with high school or less (20.5 percent, compared with 35.9 percent of the population).
There are, however, interesting differences among the groups. Non-affiliated senators have the highest shares of higher degrees, Conservative senators have the highest share of high school or less, with the majority of Liberal senators having a BA/BSc.
CHART 8
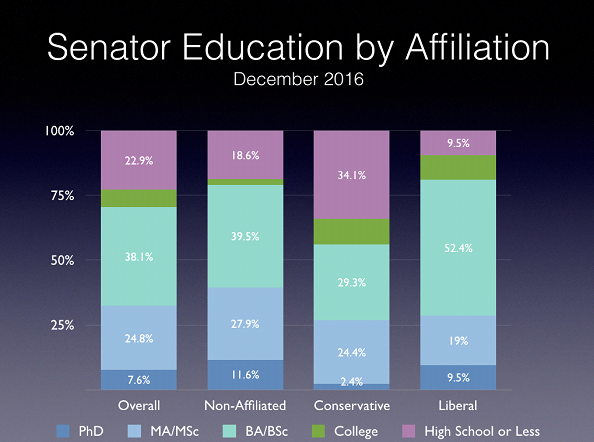
Chart 9 looks at the areas of study for senators with post-secondary education:
Not surprisingly, law, the arts (for example, languages, English, history) and the social sciences (mainly political science, criminology, economics, sociology), are the three top areas of study, comprising 64 percent. Non-affiliated senators have proportionately more law and social science degrees, Conservative senators have comparatively more arts degrees, with Liberal senators having more management degrees.
CHART 9
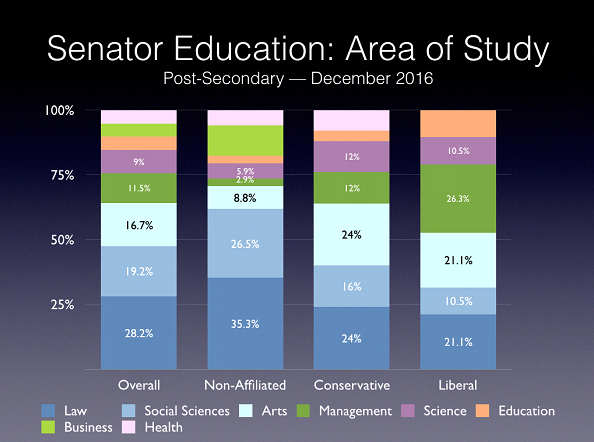
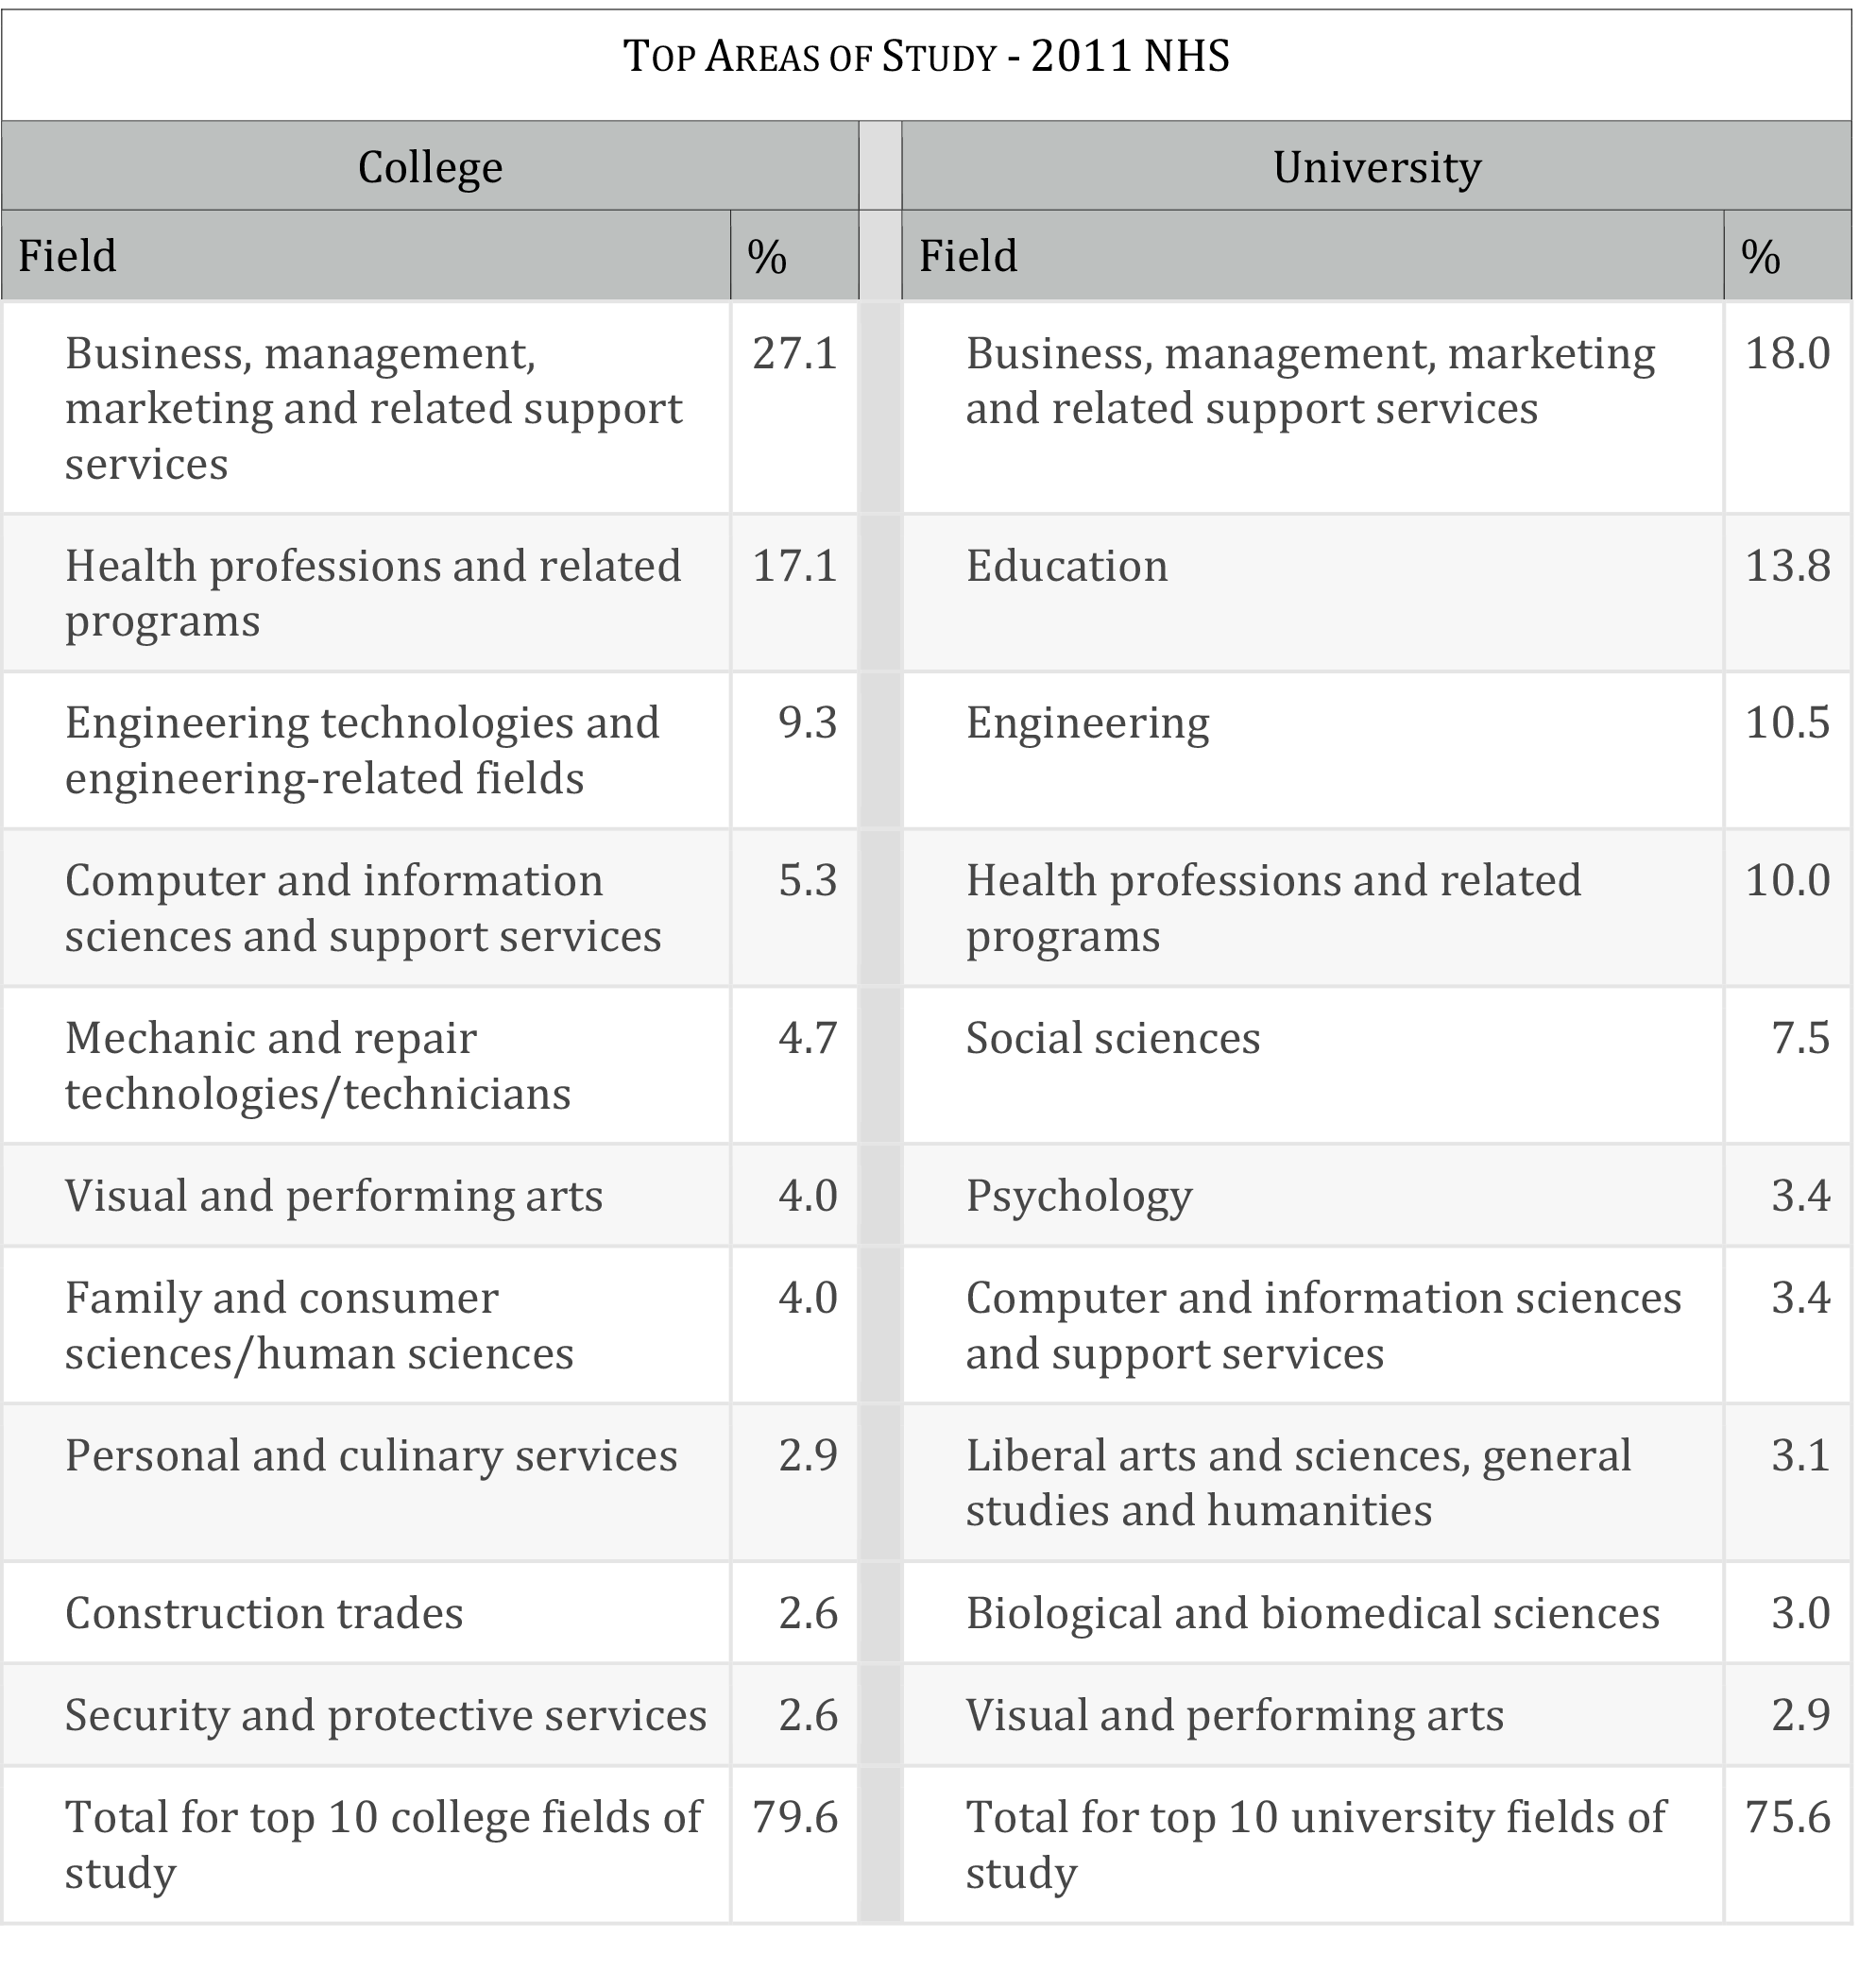
Table 1 compares these numbers with the overall Canadian population. It shows the degree to which senators are over-represented in law, the arts and social sciences, and under-represented in business and management, health professions, education and engineering.
TABLE 1
Occupation
Turning to senators’previous occupations, chart 10 shows a somewhat different picture than the educational backgrounds, particularly with respect to business representation. However, lawyers form close to 20 percent of occupations, followed by activists or advocates (such as prisons’ rights advocate Kim Pate) and politicians.
CHART 10
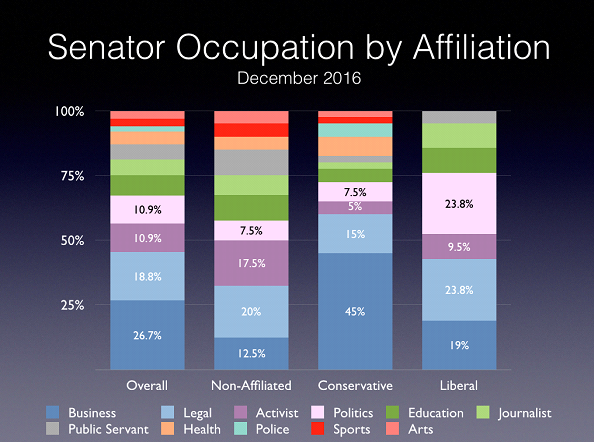
Again, differences among the three groups are revealing. Liberal senators, largely dating from the Chrétien government, are predominantly lawyers or former politicians, and a significant number have a business background. In contrast, half of Conservative senators, largely Harper appointments, have a business background, many with a small business background (such as realtors, insurance brokers, family businesses). The group of non-affiliated senators, particularly the 28 appointed by Prime Minister Trudeau, includes relatively more activists than the other groups (largely on the left, in contrast to Conservative senators who have an activist background more on the right), relatively fewer with a business background (largely from larger companies), and a generally more diverse range of backgrounds than the other two groups.
Leadership and committees
Another view is that of leadership positions with respect to the affiliations and committee chairs, as well as overall committee membership.
Chart 11 looks at the leadership positions: affiliation leader, affiliation whip, caucus chair and speaker. The Conservatives have gender parity, with one visible minority in a leadership position. The Liberals have no women or visible minority senators in leadership positions. The non-affiliated group only has one woman, with no visible minorities. No Indigenous senators are in leadership positions.
CHART 11
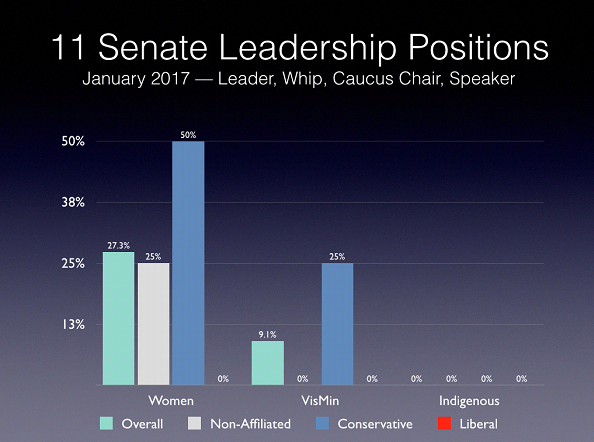
Chart 12 looks at the allocation of the 17 committee chair and 13 deputy chair positions among Conservative and Liberal senators. As part of the agreement to ensure appropriate representation of non-affiliated senators by increasing the number of committee members, no change was made to these leadership positions.
Overall, women senators hold only four chairs (out of 17) and six deputy chairs. There are no visible minority chairs and three visible minority deputy chairs. There is only one Indigenous senator chairing a committee (Senator Dyck) and there are no Indigenous deputy chairs. There are no disable people in either chair or deputy chair positions.
Non-affiliated senators hold no chairs, and they hold only one deputy chair (Senator Anne Cools, a visible minority woman). Conservatives hold 12 chairs, only one of who is a woman (Senator Raynell Andreychuk). Conservative deputy chairs include two women, one of whom is visible minority (Senator Salma Ataullahjan). Liberals hold five chairs, three men and two women, one of which Indigenous (Senator Lillian Dyck).
CHART 12
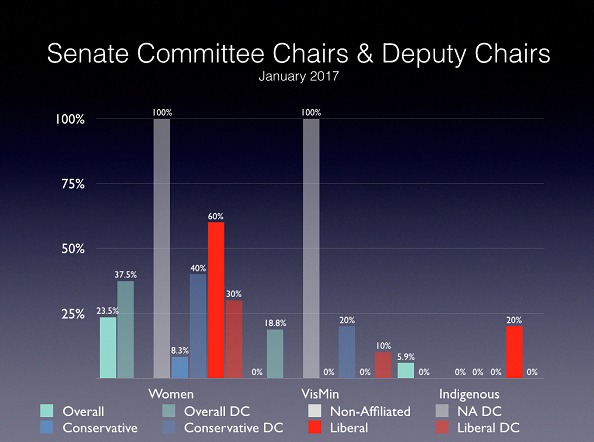
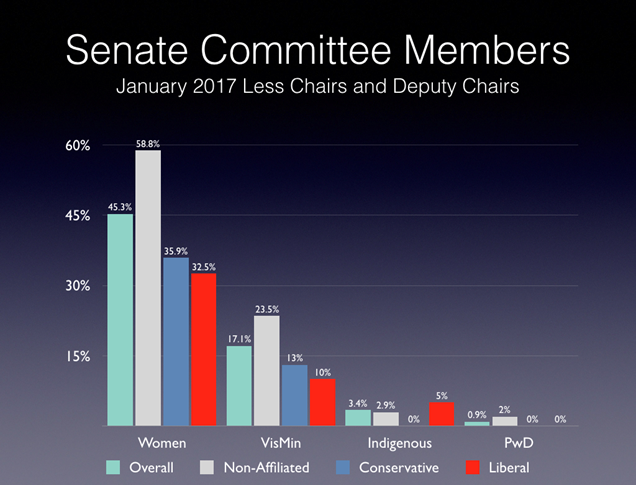
Chart 13 provides a breakdown of the 234 committee members (not including chairs and deputy chairs).
Overall, women comprise 40 percent of the members, visible minorities 15 percent, Indigenous people 3 percent, and persons with disabilities less than 1 percent, which largely reflects overall senate diversity.
The breakdown by affiliation reflects the overall diversity numbers, with non-affiliated senators having more women, visible minority, Indigenous and persons with disabilities than Conservatives or Liberals.
CHART 13
The Harper government made a conscious effort to increase the number of visible minority senators and those with a wider range of educational and occupational backgrounds. The current government has largely delivered on its diversity and inclusion commitment with respect to gender and ethnic diversity, but this has resulted in more highly educated senators, with a narrower range of professional occupations. The medium to long-term impact remains to be seen but the initial impact appears to be a more activist senate, willing to propose and make changes to legislation passed by the Commons.
Photo: The Canadian Press/Sean Kilpatrick
Do you have something to say about the article you just read? Be part of the Policy Options discussion, and send in your own submission. Here is a link on how to do it. | Souhaitez-vous réagir à cet article ? Joignez-vous aux débats d’Options politiques et soumettez-nous votre texte en suivant ces directives.