What do recent elections indicate about Canada’s ability to integrate immigrants and visible minorities into political life? From 2015 to 2021, demographics and political realities have continued a trend of slow and steady increases in representation in terms of both candidates and elected MPs, one that compares favourably with other countries’ legislatures.
There do remain, however, notable disparities in political participation and representation among different groups. This reflects a variety of factors. For example, how they are concentrated in specific ridings, the proportion who become citizens, their general political habits and whether their ethnic media encourage political participation.
As the 2021 census data have not been released yet, to set up population benchmarks, we have extrapolated from the 2016 census: from visible minorities forming 22.3 per cent of the total population to an estimated 25 per cent, and from 17.2 to 20 per cent of the subset of visible minority citizens eligible to vote and run for office.
For our purposes, a simple extrapolation would suggest a population benchmark of about 25 per cent and a citizenship benchmark of about 20 per cent would be about correct. So, while parliamentary representation continues to improve, it remains at 15.7 per cent, significantly below either benchmark. Part of this reflects, of course, the 109 ridings with less than five per cent visible minorities.
Both of these standards are useful, but they emphasize different aspects. The total population benchmark highlights participation possibilities (for example – political activism and party membership by non-citizens) while the citizen benchmark emphasizes the narrower but important requisites of eligibility and recruitment.
Candidates provide a more informative measure of visible minority political participation than elected MPs. While candidates are subject to the vagaries of riding-level nomination contests, these barriers are less than the hurdles to being elected as an MP.
In 2021, visible minority groups represented 18.2 per cent of the all the candidates from the six main parties: the Liberal Party (LPC), the Conservative Party (CPC), the New Democratic Party (NDP), the Bloc Québécois (BQ), the Green Party (GPC) and the People’s Party of Canada (PPC). Very much on the positive side, this compares with 16.8 per cent in 2019 and 13.4 per cent in 2015. Still, judging by the population benchmark, visible minority candidates remain significantly under-represented, somewhat less so by the citizen benchmark.
Table 1 shows what percentage of each party’s candidate team in 2021 were comprised of visible minority candidates and highlights the change from 2015.
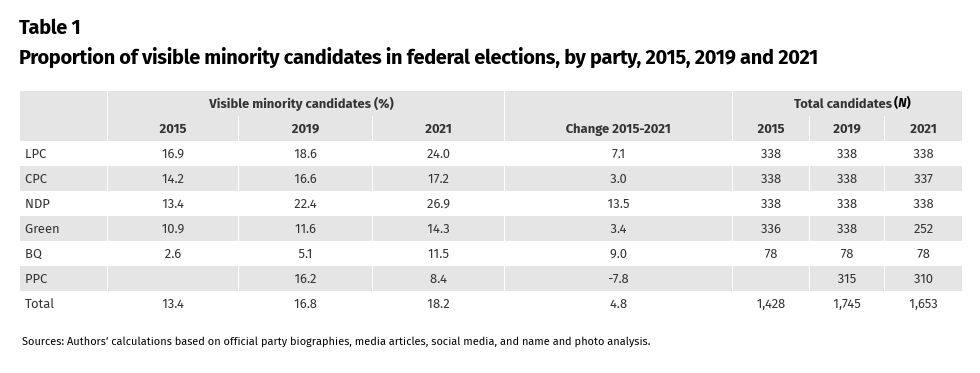
Importantly, all parties, except the PPC had by 2021 increased the proportion of their visible minority candidates. Of particular interest is the larger increase of the Liberals when compared with the Conservatives. While the Bloc grew its share of visible minority candidates significantly, these were largely in non-competitive ridings in Montreal and suburbs. The NDP had the largest growth overall, and the PPC ran only half as many visible minority candidates in 2021 relative to 2019.
Table 2 breaks down the candidate data further by visible minority groups for 2021, and again in comparison to 2015. In general, the three major national parties ran a noticeable number of candidates from all groups except Filipino, Korean and Japanese.
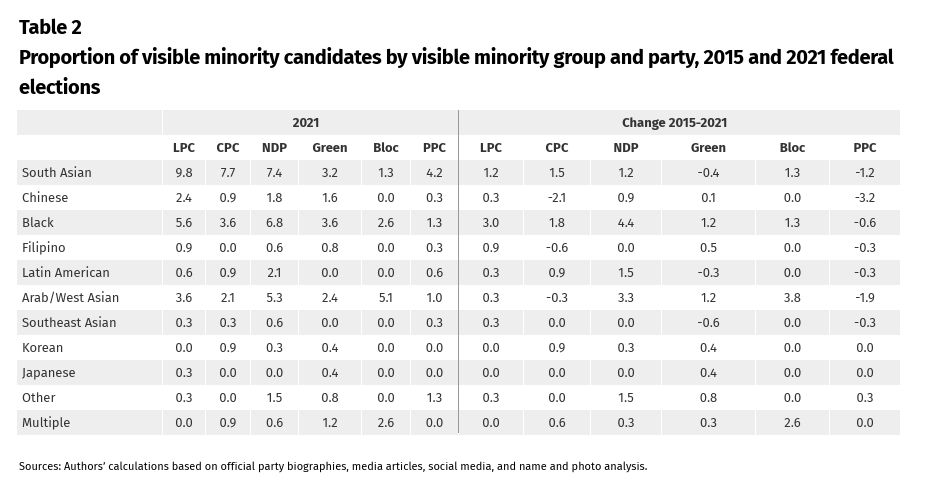
Filipinos, the fourth largest visible minority group in Canada, were particularly under-represented as candidates, as were Chinese candidates. South Asian candidates, in contrast, were over-represented in all three parties as were Arab/West Asian candidates. Interestingly, Liberal and NDP Black candidates were over-represented compared to their share of the population. More generally, as a whole, the 2021 election witnessed a near doubling in the percentage of Black candidates relative to 2015 and 2019, reducing what had been an important and persistent gap in representation.
Slow and steady increases also characterize the incidence of visible minorities elected as MPs. Their numbers increased from 47 in 2015 (13.9 per cent of the House’s membership) to 50 in 2019 (14.8 per cent) and to 53 (15.7 per cent) in 2021. To some extent, this is independent of parties given that in ridings with large numbers of visible minorities, all major parties run visible minority candidates. Again, while this is a positive development, their representation remains below what might be expected based on the two benchmarks.
This mirrors the increase in representation of women, from 88 MPs in 2015 (26 per cent) to 103 in 2021 (30.5 per cent) and Indigenous MPs from 10 (three per cent) to 12 (3.6 per cent) over the same period.
Table 3 breaks down visible minorities elected in 2021 by party – the percentage they comprise of each party’s caucus – and does so as well for 2015 and 2019. As ridings with large numbers of immigrants and visible minorities tend to have visible minority candidates from all parties, the overall electoral result typically determines which party has greater visible minority representation. In 2011, a Conservative majority meant 12 visible minority MPs compared to two for the Liberals, while 10 years later, reflecting the overall shift in those ridings, the Conservatives had elected only six compared to 43 for the Liberals.
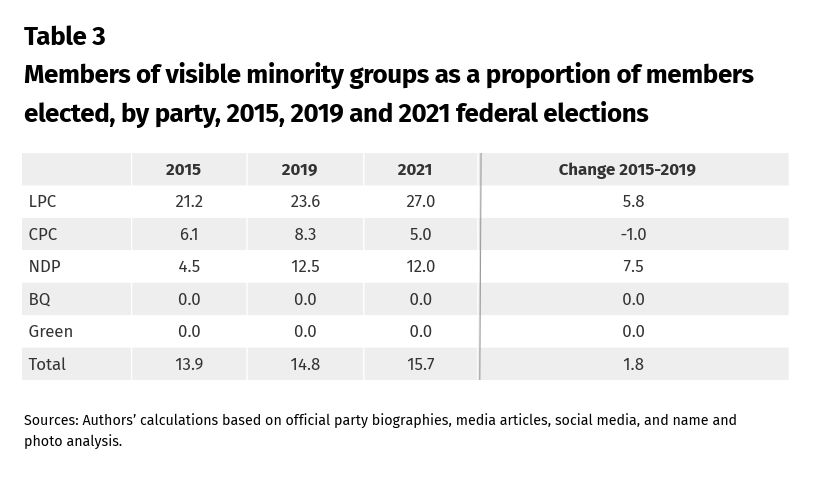
With regard to the intersection between origin and gender, 34 per cent of the visible minority MPs elected in 2021 were women, compared with 29.8 per cent of their non-visible minority counterparts, an increase compared to 2015.
At the same time, the number of immigrants (foreign-born Canadians) elected has slightly decreased since 2015, from 46 to 44 (13 per cent of all MPs, due to Conservative losses); over 70 per cent, not unexpectedly, are visible minority immigrants.
Finally, table 4 breaks down the party caucus percentages even further by visible minority group, again comparing 2021 with 2015, and with cabinet minister data added.
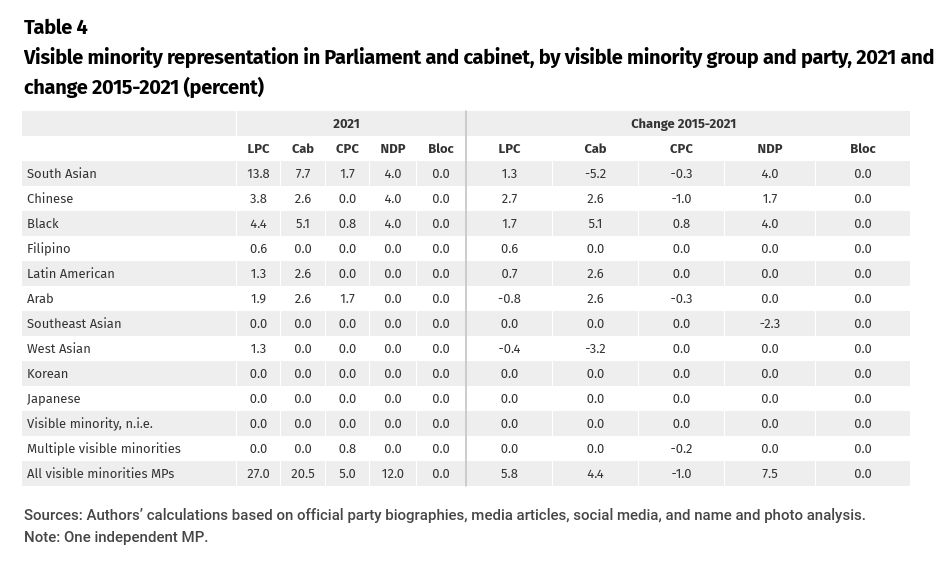
As can be seen, the largest visible minority groups have the largest numbers of MPs in the three major parties, as well as ministers. What is relatively new, however, is that this includes noticeably more Black MPs, whose numbers nearly doubled from five (in 2015 and 2019) to nine in 2021. On the other hand, Filipinos are the most under-represented along with Southeast Asians and Japanese. In terms of cabinet diversity, the large over-representation of South Asians in 2015 has been reduced. Chinese and Latin Americans, with no representation in 2015, were appointed ministers in 2019 and 2021, addressing the imbalance. This was especially the case for Black ministers.
How does Canada compare with other countries in terms of representation of visible minorities in their legislatures?
In the U.S., visible minority groups represent 23 per cent of the Congress and Senate, compared with 40 per cent of the population, and only three per cent of them are immigrants. In Australia, only 4.1 per cent of parliamentarians have a non-European background, with 10 per cent being immigrants. In the U.K., about 10 per cent of MPs are from visible minority communities.
The 2021 federal election in Canada demonstrated the continuing political integration of immigrants and visible minority groups. This is in sharp contrast to their representation in other Western democracies, perhaps suggesting there is a greater resilience here to the type of anti-immigrant populist sentiment that has proliferated elsewhere. Correspondingly, the major Canadian parties, mindful of electoral imperatives, continue to increase their efforts to recruit candidates from under-represented visible minority groups in ridings that are potentially winnable. At the same time, cultural communities would do well to encourage political participation among their members.
Addressing political under-representation would help ensure that cultural community interests are reflected in policy and parliamentary deliberations, thus further facilitating their integration into Canadian society.
Methodology
We drew on a mix of official party biographies, media articles, social media, and name and photo analysis. Two benchmark extrapolations from 2016 census data were used to assess political representation: the total visible minority population (25 per cent) and the visible minority citizenship population (20 per cent).