


A prevailing feature of elections in Canada in recent years, and more prevalent than ever in the most recent federal election, has been the regular release of polling on the vote intention of Canadians — the “horse race.” Polling data on party preference has long been a factor in elections and the media’s coverage of political debate. Rapid development of relatively inexpensive sampling methods like interactive voice response telephone technologies and online surveys has reduced the cost and time involved with data collection very substantially. In the most recent election this allowed for the almost daily release of surveys of Canadian voting intention.
Among the media organizations, The Globe and Mail was most committed to public opinion research. Working with Nanos Research, it released rolling poll numbers on a near daily basis, tracking opinion with 400 cases nightly. However, all major media organizations had relationships with polling organizations, and it was rare for a day to go by without a poll being made public. Those politicos without access to the inside party numbers waited impatiently for the fix, and used them to set the daily agenda for political discussion. In the final weekend before the vote on May 2, seven polls were published that included data from interviews and online surveys conducted during the final four days of the election. This was two more polls than in 2008, when five firms published results that reflected interviews conducted within four days of the vote on October 14.
This article will make three arguments. First, the polling commissioned by the media is superficial. It failed to contribute to democratic debate, and it did not provide an understanding of why Canadians were voting as they did. Second, even within the limited objectives of campaign polling, the research conducted was not terribly successful. Third, the research industry would benefit by being more transparent about the methodologies used to arrive at the numbers. Discrepancies between polls created a lack of confidence in the industry as a whole. Yet these discrepancies are often the result of different methodologies, in particular, different questions used to assess vote intention, different placement of the question and differences in the populations reported on. Being more forthright about these methodological choices would help maintain confidence in the discipline.
The research industry would benefit by being more transparent about the methodologies used to arrive at the numbers. Discrepancies between polls created a lack of confidence in the industry as a whole. Yet these discrepancies are often the result of different methodologies in particular different questions used to assess vote intention, different placement of the question and differences in the populations reported on.
The overriding objective of every polling firm in this election was to accurately call the final outcome for the nation. However, Canada doesn’t have a national election. It has a series of regional elections, with different competitors, different issues, and different dynamics.
Therefore, national results are not terribly revealing when trying to forecast an election result. It is the provincial and subprovincial results that provide that insight. This requires sample sizes larger than most polling or media organizations are prepared to pay for. Yet the media were focusing on national numbers, and no polling firm was polling sufficient sample sizes of provincial or regional electorates to provide reliable estimates. A provincial sample of less than 300 cases is not very useful. The consequence was an unprecedented amount of polling that failed to forecast accurately key the regional results that determined the shape of the House of Commons.
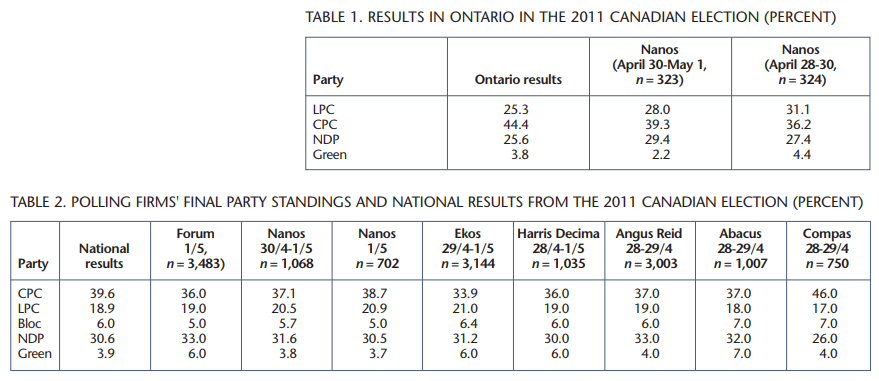
For example, no company released results that were close to correct about Conservative support in Ontario, which provides a third of the seats in the House. It was Ontario that provided the Conservatives with their comfortable majority margin. Of the polls released closest to the election, none were within four percentage points of the actual Conservative vote share, and all overestimated the strength of the NDP. In a threeway fight, four points either way can result in a huge shift. The seat projection model we use at the Gandalf Group illustrates this. Had the result in Ontario been as Nanos Research predicted, it would be the Conservatives Party, by our calculation — not Nano’s who does not do seat projections — would have won 58 Ontario ridings instead of the 73 they did win (see table 1). That is the difference between a minority and a majority government. The Liberals would have won 27 seats in Ontario, rather than the 11 they did. Nanos is not an outlier — other companies were showing similar results — and Nanos was among the most accurate at the national level. But if the purpose of all the research publicly released during and at the end of the campaign was to tell Canadians, before votes were cast, what the result was going to be, then none of the polling firms can claim success (table 2).
Seat projection models are not run on national polling data. The most rudimentary are based on provincial polling results, while the more sophisticated models require subprovincial data to be sensitive to the ways in which Montreal is different from the rest of Quebec, and the way the rural west is different from the urban west.
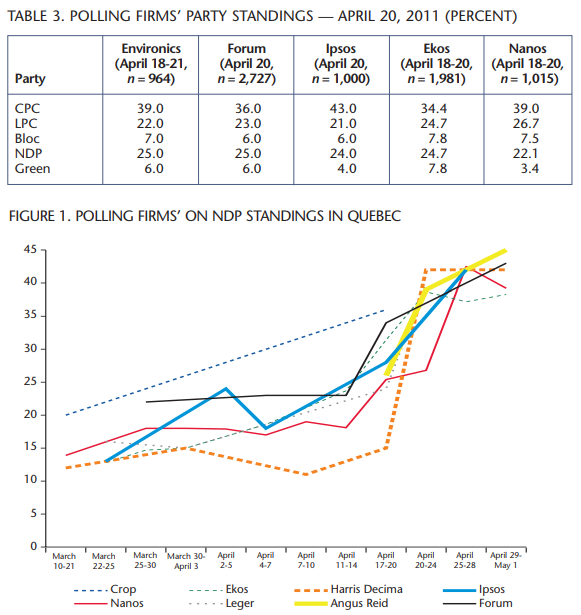
As demonstrated with the Ontario example previously, none of the publicly available national polls had even provincial sample sizes large enough to be reliably used in these models. (CROP, which ran an online poll with 1,000 Quebecers in April 13-20 not only had a large sample for the entire province that rivaled pan-Canadian omnibus sample sizes, but it was the first to capture the large share of the vote the NDP subsequently won — see figure 1).
The blog ThreeHundredEight.com tried to deal with this by averaging polls, hoping that the error each organization had in its regional numbers would get washed out in the average. However, averaging a number of polls with different sample sizes, different question wording, different question ordering, and taken over different time periods leads to something that is less precise than would be desirable. Voters looking to that model for strategic advice were told the Conservatives were certain to win a plurality of seats, but had no real chance at a majority; that the NDP and Liberals were evenly matched; and that a strong complement of Bloc Québécois MP’s would be returned to the Commons.
Any effort to compare various polls directly or even aggregate them is also challenged by the fact that so many different variations in method and questionnaire design will affect what each poll records. Indeed, while the “horse race,” or daily standing of the parties in the election, was a focus of media coverage, a secondary story was the discrepancy between polls. Polls published in the third week of April had a nine point discrepancy among the Conservative vote numbers of one polling firm and the Conservative numbers of another, leading media commentators to begin questioning the methodologies of the various polling firms.
Error in election research can come in many different guises, including simply not being in field when the tides turn. On April 25, most observers woke up to the daily Nanos tracking that showed the Conservatives inching toward a majority. About that Nanos may have been right. But it showed the NDP still at 23 percent nationally and behind the Liberals. A poll conducted by Ekos came out later that day and showed a dramatically different picture, with the NDP surging past the Liberals to levels that threatened the Conservatives. In this instance, news had already filtered out of Quebec on Thursday April 21 about a stunning development: seemingly overnight NDP support had multiplied to the point where they were ahead of the Bloc Québécois, according to the CROP survey referenced above. The following Friday Easter weekend began. Nanos did not poll continuously through that weekend. That decision meant that they did not catch the same wave that the Ekos poll, taken through Easter weekend, showed. On Monday April 25, the Nanos data (because it was based on three-day rolling totals) that many were trying to make sense of had surveys in it from Wednesday April 20, an eternity ago in political terms. Because of its methodology, Nanos was unable to catch up to the new dynamic of the campaign until Thursday April 28. A research program that was designed to provide the most timely information had temporarily become a lagging indicator.
Discrepancies between polls can arise for a variety of reasons that have nothing to do with actual error. We wrote in 2008 about different sampling methodologies and techniques for gathering response. An issue rarely considered when the media are comparing results is the how respondents were asked about their vote intention. Readers of the major dailies or online news sites could routinely see polling results from various firms contrasted with each other, with details of the dates, sample sizes and method by which responses were obtained. But rarely was there any footnote in those media reports to allow comparison of the questions used to determine vote intention. Differing terminology used in the vote intention question is easily one of the most important reasons why companies report results with at least slight variations. A poll that asks respondents in an open-ended way what party they would vote for will yield a very different response than a survey that asks voters to choose between a list of parties (either read aloud or listed on screen) with their leaders’ names alongside. Nanos Research employs such an innovative open-ended approach to asking party vote intention that does not provide any reminder to the respondent about the party options. One consequence is that Nanos data always has the Green Party at a lower level of support than the other polling companies, and at a level closer to what the Greens actually receive in the ballot box. There are a variety of theories about the best way to ask the question. When we did the research for the Liberal Party of Canada, we used a question that named both party and leader. Our hypothesis was that those were the two factors most likely to determine vote intention. But all of those prompt the respondent to think about the choice in a specific and different way.
Location of the question in the survey instrument is also going to have an impact on results. The cleanest read on voting intention is to have it at the very beginning of the questionnaire, before the respondent has been prompted to think in one direction or another. Some organizations like to place issue questions before vote intention. In doing so, they are manipulating the result, but deliberately in a way that is consistent with their theory of how a voter’s preference is constructed. It is a legitimate approach, but should be disclosed, along with the actual questions that precede vote intention.
The results to be most wary of are those that are the product of vote intention questions tacked onto an omnibus study. It is impossible to determine what the respondent had been thinking about for the fifteen minutes before they were asked how they intended to vote. It may have been about muffins, but it might also have been about retirement savings, energy policy, or credit card charges — any of which might materially impact how a voter might think about politics.
The other element that is critical, for both popular vote and seat projections, is identifying the cohort of Canadians that will actually cast a ballot. Slightly increased turnout in this election brought voter participation up to 61 percent. There is no reason to assume that the Canadians who do not vote have the same motivations or party preference as those who do but when one looks at voting intention among the entire population, that is exactly the assumption that is being made. Therefore, identifying the likely voter is critical to understanding how the election is going to turn out and failing to accurately identify this cohort will constitute error as profound and anything of a sampling or question nature. An effective likely voter screen requires a minimum of five to seven questions relating to previous voting behaviour and current levels of political motivation. Most companies are not prepared to devote the resources necessary for that kind of comprehensive questionnaire. It also requires a larger sample to begin with, since you are going to be throwing out 40 percent of your responses.
Unless one can find some evidence for a systemic anti Conservative bias in the polling industry, that they looked at the entire population rather than likely voters is a very plausible explanation for why many polling companies, though not Nanos nationally, underestimated the Conservative vote by three to four percentage points. At the most simplistic level, for example, it was understood that older voters (more likely to turn out) were more likely to support the Conservatives than young voters (much less likely to turn out) were. Voters were more supportive of the Conservatives than the Canadian population as a whole.
So far we have judged the campaign polling on the basis the companies and their media sponsors presumably want to be judged. Were they first on trends in vote intention and did they come closest to calling the final result?
But there is a much broader basis on which to judge. Public opinion polling fell far short of the function it could have performed in the 2011 election. This election could have offered the opportunity for Canadians to grapple with the issues that matter to us, to explore the ways that government might address those issues, and then to choose which party most represents our concerns and our preferences for action.
For the election to have fulfilled that promise required that the media — which create the election narrative or “What the election is about” — cover issues of importance to the electorate. Public opinion research can be an effective, powerful way for the electorate to contribute to the narrative of the campaign by allowing the public to define the issues of importance and thus requiring that parties respond as to how those issues might be resolved. It didn’t happen. Instead, public opinion research turned the election into just another sporting event during the NHL playoffs.
Public opinion research didn’t just allow that dynamic, it created it. The election turned from what do we want government to do to who is going to win the game. By focusing solely on vote intention and impressions of the leaders, it limited the electorate’s input to the grand narrative to who they liked and didn’t like. It was a long, drawn out reality show. And following the main story — the running scoreboard — the pundits critiqued the performance of the leaders and the campaign tactics. In any competition, the most tantalizing unknown is who will win. When we have a tool that gives us daily updates on this unknown, the entire election becomes focused on the latest standings in the contest and what happened yesterday to cause that. The electorate’s role is reduced to picking a winner.
It is strange that every media organization wanted to do exactly the same thing — distinguish themselves from one another by whether their poll was a point or two different from another poll. None of these media organizations sought to distinguish themselves by using polling to enlighten or explain or delve much further into the array of platform promises or the underlying concerns of each party’s base or swing voters.
Nanos asked about vote intention, three questions on leadership, and self-reported responses around whether policy, party or leadership most influenced vote and one issue question — the most important issue facing the nation. Ekos asked a series of vote intention questions and most important issue. Innovative Research Group asked about vote intention and then spent the rest of the survey asking about the effects of campaign events. In addition to vote intention, Angus Reid asked Canadians which leader they thought could best manage five policy areas, but this is still a leadership question.
It is commonly assumed that the focus on vote intention is due solely to lack of funding for more policy oriented (usually longer) surveys. However, the sheer survey space given to decided vote intention, leaning vote intention, second-choice vote intention, commitment of vote intention, enthusiasm for vote intention, likelihood of changing-vote, past vote choice, and strategic vote intention makes it clear that organizations are making conscious choices to focus solely on the daily party standings and likely winner. These are all important measures for party pollsters — when we conducted research for the Liberal Party of Canada during the 2004 and
2006 elections, we had to know where we might gain and where we might lose and why. But for the media and for public consumption, trying to figure out every possible permutation of vote is purely the professional egotism of wanting to be the first one to tell the public which candidate has the greatest chance of getting kicked off the island.
Maybe next election some media company will identify that here are enough people trying to forecast what will happen — the news hole is in explaining why it is happening or how it could be different.
While leadership is an important consideration in vote choice, explanatory analysis of voting finds that it is only one consideration. In fact, impressions of leadership are not distinct from the leader’s position on policy — the issues that are considered a priority by the leader, the issues the leader is seen to threaten, and the policy prescriptions for tackling issues. The relationship among leader impression, issues of importance and policy are complex and deserve attention. Reporting only on impressions of the leader without looking at underlying factors reduces leadership to an individual popularity contest.
The media already rely on public opinion research for their headline. Citizens should be able to rely on public opinion research as a critical instrument in dialogue — in making visible diverse Canadian perspectives, shedding light on what Canadians are considering and how those considerations are represented in our political parties. When research doesn’t play that role, a superficial judgment of the leaders defines the election.
It isn’t realistic to suggest that we will ever have elections without daily standings, but we could at least augment the daily standings. Research can contribute to the dialogue by simply allowing the public to speak on something other than vote choice or leader impressions. Regardless of academic arguments about which of leadership or policy affects vote intention the most, or the more complex reality of how they are associated, Canadians believe they are making their vote choice based on policy more than any other factor. Nanos tracked self-reported vote influence, and almost half of Canadians say party policies are the most important consideration in their vote, while around one-quarter of Canadians say leadership. Policy, then, is where research firms should be focusing attention. There are simple ways that research firms can do this.
Beyond the single top issue, respondents could rate issues in terms of importance. Just understanding what is seen as an “issue” and how that differs for different groups within Canada is fascinating. It will differ by life stage, by gender, by region, by income. Which issues are broad-based? Which issues are particular to certain groups? Why is it an issue? How does that affect vote?
Or research could identify the gaps between how important an issue is and how well respondents think the issue is being addressed. Where are the largest gaps — the areas in our lives that need much more government attention? How does that differ for different Canadians? Which parties are seen to offer the best solutions, and by whom?
Research could explore issues in depth — the gun registry for example. Even definitions of the problems are illustrative — some see it as gun control, others as penalizing law-abiding farmers. Which values are at stake, depending on the definition of the problem? Any number of issues could be explored, where the public weighs in on the parties’ different policy options for addressing it.
These types of questions are as easy to ask as leadership batteries — but these questions turn the attention back to what the electorate cares about — what do I want the government to do and to not do?
In addition to providing a way for citizens to help direct the debate in the campaign, policy and attitudinal questions would provide the pollsters and the media who cover them with some ability to explain why things are happening. The 2011 election was a campaign full of dramatic developments — a Conservative majority, the collapse of the Liberal Party, the virtual disappearance of the Bloc Québécois, the NDP taking Quebec by storm. It was a campaign full of unanswered questions: Why did a Conservative campaign that left so many completely cold also appeal strongly to 40 percent of the electorate? Why did the NDP take off in Quebec? How could the Bloc Québécois disappear completely; Why did the Liberal vote collapse, despite a campaign that drew large and enthusiastic crowds and that was cheered on by the media? All of these are things that could have been determined by research if the right questions had been asked. Yet, despite more polling than ever before, pollsters could only stammer and speculate to explain any of these factors.
Maybe next election some media company will identify that enough people are trying to forecast what will happen — the news hole is in explaining why it is happening and how it could be different.
Photo: Shutterstock