(This article was translated from French.)
To everyone’s surprise, the Coalition Avenir Québec (CAQ) won in the October 1 provincial election by 12.6 percentage points over the Quebec Liberal Party (QLP), even though the polls had shown the two parties to be practically even in terms of voting intentions.
As the analysts (this author included) pointed out, it was even more surprising because historically polls have tended to underestimate QLP support, especially when there was a risk the party would lose power, and to overestimate support for the smaller parties. So everyone expected a much closer result between the two leading parties and a wider gap between the other two parties, Québec Solidaire (QS) and the Parti Québécois (PQ). The election results proved them wrong. The gap between the polls and the actual vote for the leading parties was the largest ever recorded in Quebec political polling history, surpassing even that in the 1998 election. What happened?
The polls and the results
The evolution of voting intentions during the campaign according to the polls is mapped in figure 1. The dots represent the pollsters’ predictions, while the lines represent the evolution of the voters’ intentions as estimated by local regression, a method that assigns less weight to outliers and accounts for evolution over time. Based on the estimates of all the polls published since the beginning of August 2018, 32 percent of the votes should have gone to the CAQ, 29 percent to the QLP, 18 percent to the PQ, and 17 percent to QS. But as it turned out, 37.4 percent of votes went to the CAQ, 24.8 percent to the QLP, 17.1 percent to the PQ and 16.1 percent to QS.
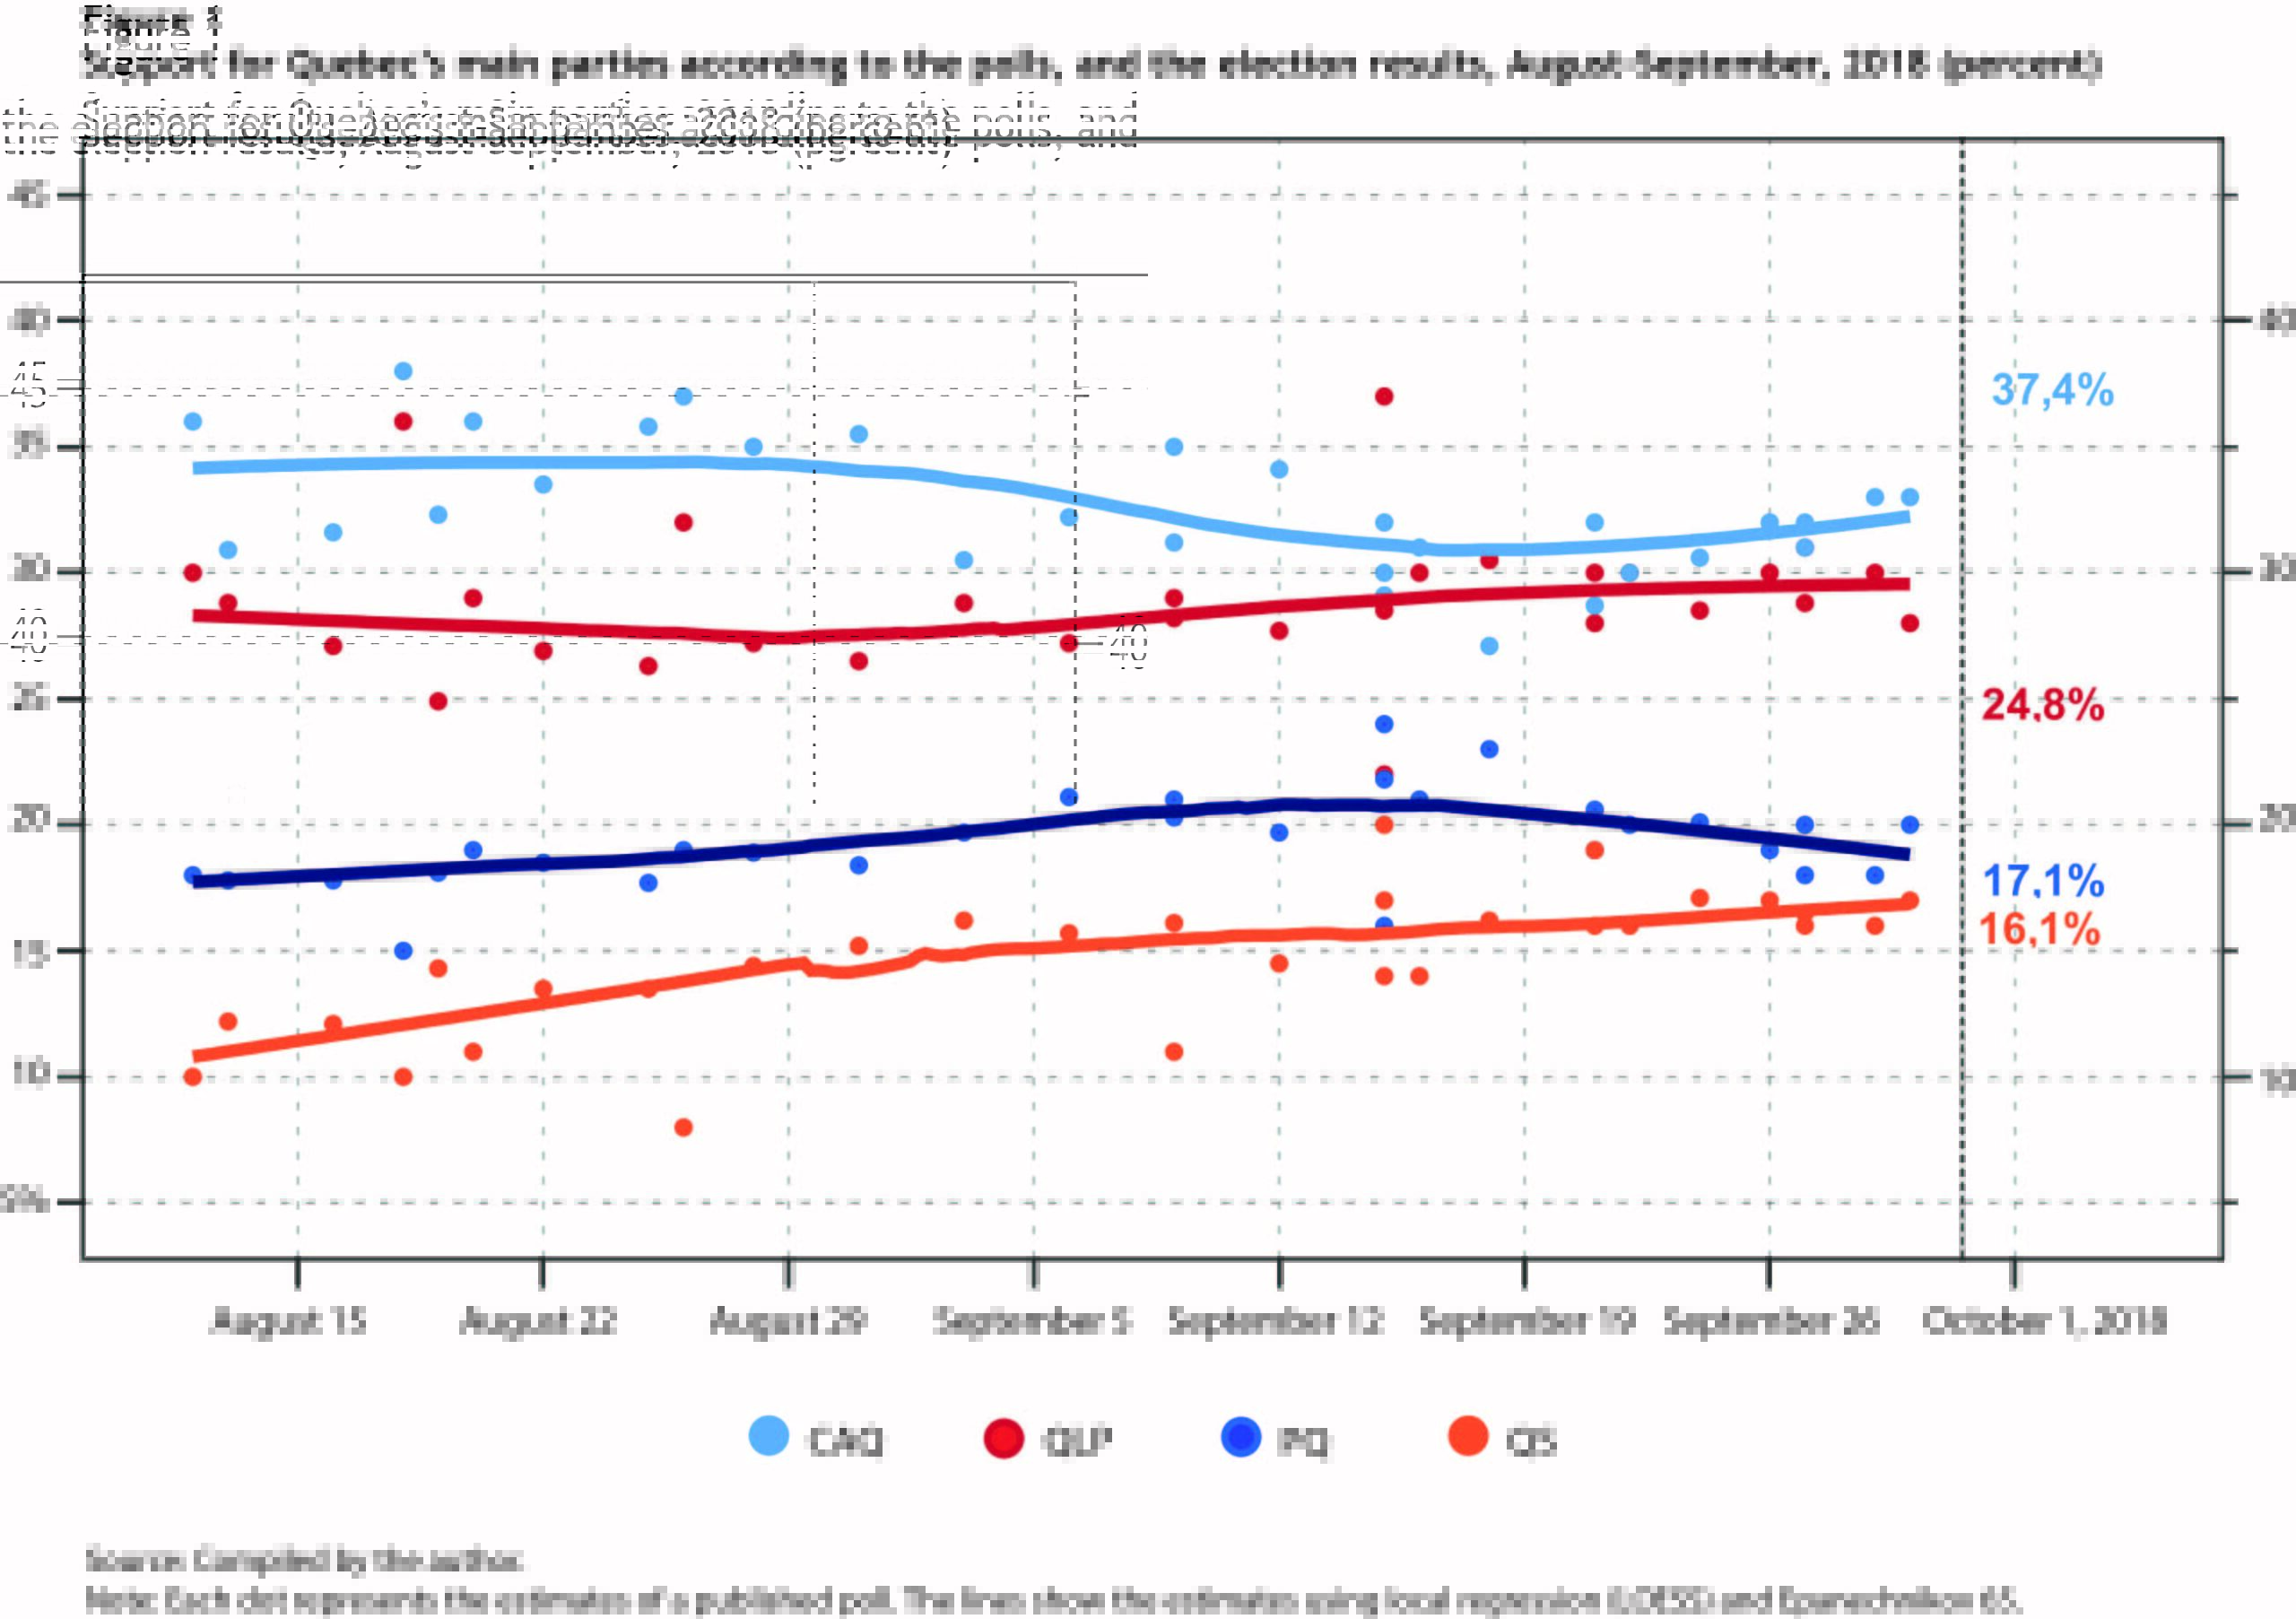
Table 1 focuses on the results of the last polls in the recent Quebec campaign, which allow us to use known sampling error indicators. By using Mosteller’s M3 and M5 measures, we can compare these results with those of other elections.
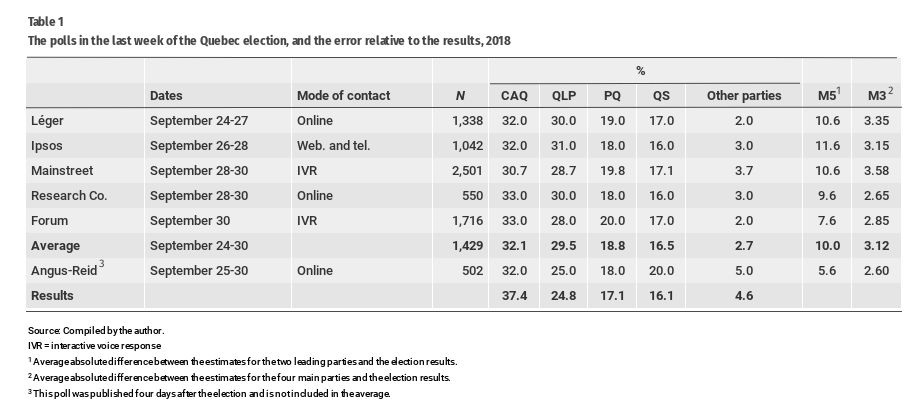
The gaps between the predictions of the last polls in the election and the election results for the two main parties (M5) varies between 7.6 points (Forum) and 11.6 points (Ipsos), with an average of 10 points. This level of error is comparable to the one seen during the 2013 British Columbia election (10 points), but well below that in the Alberta election in 2012 (17 points). In these two provinces, the predictions during subsequent elections were good, which will undoubtedly reassure pollsters and voters alike. The average error for the four main parties in Quebec 2018 (M3) varies between 2.65 (Research Co.) and 3.58 (Mainstreet), with and average of 2.6.
We can compare the error of the 2018 polls with that of the 1998 Quebec election, which represents the last “significant polling error” in Quebec. In that election, the last four polls predicted that the PQ would easily win over the QLP by an average margin of 7 points. Instead, the election resulted in the QLP gaining almost 1 point over the PQ. In 1998, in contrast with 2018, the gap between the parties was significantly overestimated and the leading party was wrongly predicted. Nevertheless, the average error for the leading parties (M5) was 7.4 points, well below that in 2018, but the average error for the three main parties (M3) was 2.9 points, above that in 2018.
Possible explanations for the gaps
There are several hypotheses that might explain the gaps between the polls and the election results for the parties that ended up on top. These hypotheses involve either unexpected voting behaviour (last-minute change in vote, change in the preferences and composition of the electorate), or methodological problems with the polls. Most of these hypotheses will have to be validated by further analysis.
Voting behaviour
It is possible that some voters decided to vote for the CAQ at the last minute, the first hypothesis. This is plausible, since the polls show a slight gain for the CAQ toward the end of the campaign, and some polls taken in the last days of the campaign show a larger gap between the CAQ and the QLP. But this hypothesis can explain only a small part of the gap, given that polls were conducted right to the end of the campaign. The only way to validate this hypothesis would be to contact the poll respondents again and ask them about their vote on election day.
The second hypothesis involves voter participation. In this scenario, not only would voters traditionally committed to the QLP have had to abstain in greater numbers, but more young QS supporters would have had to vote than in previous elections. These scenarios are plausible. In this election, voter participation was at a historic low ─ the lowest since 1927, with the exception of the 2008 election. And this drop in participation was particularly pronounced in ridings where there is a large percentage of nonfrancophones, who usually vote for the QLP.
In table 2, I show the vote share of the QLP, the voter participation rate, as well as the gap between this percentage and the provincial average, for ridings in central and West Island of Montreal with a high percentage of nonfrancophones. In all elections since 2008, voter turnout in these ridings was lower than the provincial average, with the exception of 2014 (an election in which the participation of nonfrancophones, who were strongly opposed to the Charter of Values, reached a record high). Voter turnout was particularly low in the 2008 election, in which the polls predicted a majority for the QLP, overestimating its result.
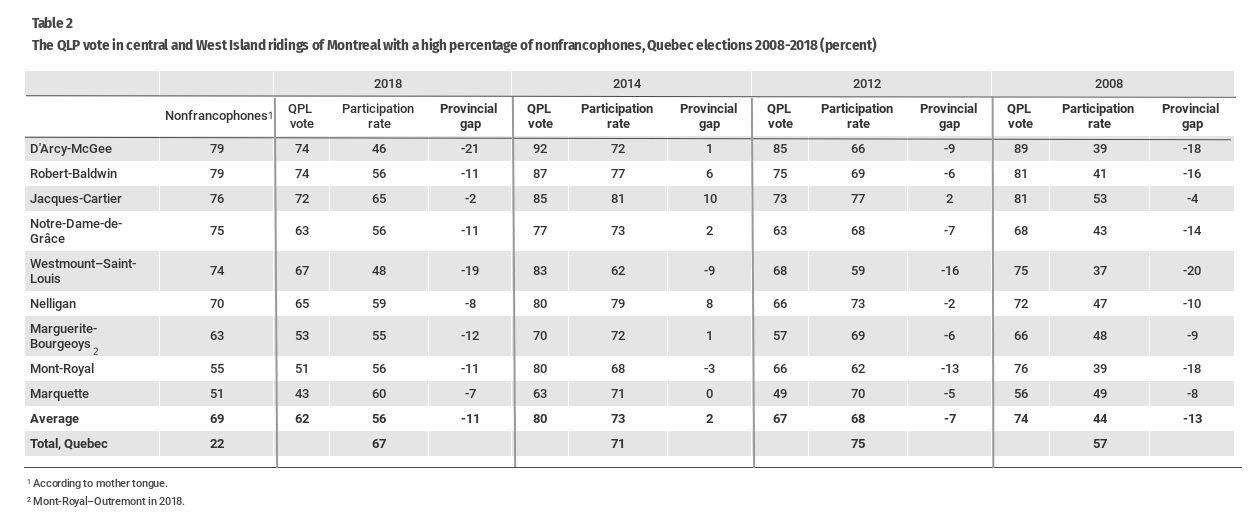 These results support the idea that nonfrancophones who live in ridings where the QLP always has a comfortable majority are mobilized when the election includes issues that are important to them. It also shows that the 2018 election did not mobilize them: participation in this group varied between 46 percent and 65 percent, with an average of 56 percent, 11 points below the average participation rate in Quebec as a whole. This gap is comparable with the one in 2008 (13 points). There is a negative relation between the proportion of nonfrancophones and participation rate: the higher the number of nonfrancophones in a riding, the lower the participation rate. This disparity could partly explain the considerable overestimation of the QLP vote.
On the other side of the equation is the underestimation of the QS vote. We know that young people strongly support this party, but that they are less likely to vote. However, statistics published by the Chief Electoral Officer of Quebec (CEOQ) show that during the 2014 election, urban young people were more likely to vote than non-urban young people. Comprehensive data from the CEOQ would allow us to validate the hypothesis of greater participation among urban young people in the election. However, this information would not explain the significant underestimation of the CAQ vote.
And what about “discrete” respondents (nondisclosers) who declare they are undecided until the last moment or who refuse to share their intentions? Studies have shown that the underestimation of the QLP vote in almost all elections — sometimes called “the ballot-box effect”— could be attributed to bias in the initial samples, less cooperation during surveys, or more reluctance on the part of QLP voters to reveal their voting intentions. As a result of this finding, analysts have allocated the nondisclosers disproportionately in order to compensate for the phenomenon. This has resulted in better estimates since the 1990s. However, it should be noted that the percentage of nondisclosers is strongly linked to the methods used by pollsters. During the recent campaign, pollsters that conducted automated telephone polls had very low percentages of nondisclosers, around 5 percent, while for online polls, the rates were slightly above 10 percent.
Therefore, not distributing the nondisclosers proportionately only effects the estimates of certain polls. The one that I used during the campaign — 50 percent for the QLP, 25 percent for the CAQ and 25 percent for the PQ ― changed the estimates only slightly, other than to confirm that the two leading parties were practically even.
In order to arrive at the election results with a hypothetical poll that gives 32 percent of the vote to the CAQ, 29 percent to the QLP, 18 percent to the PQ, 17 percent to QS, 3 percent to the other parties, and has 20 percent of nondisclosers, we would have to allocate 57 percent of these to the CAQ and only 9 percent to the QLP. If we did the same exercise with a redistribution of 10 percent of nondisclosers, we would have to allocate 82 percent of them to the CAQ and 0 percent to the QLP, which would still be an overestimation. Therefore, the hypothesis that the polling error was caused by the erroneous distribution of nondisclosers doesn’t seem plausible. The hypothesis of the presence of nondisclosing CAQ voters, however, cannot be rejected.
Pollsters’ methodologies
The pollsters used various methodologies to conduct their polls. Whether they used automated telephone polls (Mainstreet and Forum), online samples (Léger, CROP and Research Co.) or a combination of online samples and telephone interviews (Ipsos), the levels of error for the five companies that issued polls in the last week of the election campaign are quite similar, with the exception of the Forum poll, which was conducted the day before the election. Therefore, we cannot really attribute the error entirely to the samples, unless we believe that the pollsters, whatever method they used and whatever the source of their samples, were less successful in reaching voters who supported the CAQ. Given that the information provided about the samples and their weighting is not always thorough, it is not possible to take this issue much further.
What should be done?
The best solution would be for a grouping of polling companies to get across-the-board agreement to conduct an independent study on polling errors in the 2018 election, similar to what the British Polling Council did after the 2015 British election. Unfortunately, the Marketing Research and Intelligence Association, an organization of Canadian pollsters, was disbanded in July 2018, just two months before the Quebec election. If the pollsters wish to regain public confidence, it would be in their best interests to attempt to understand what happened. Since last-minute changes or electoral volatility can explain only part of the error, it is essential that they go back to the sample and compare voting intentions announced during the campaign with voting behaviour on election day. To reassure voters, the results of these analyses should be made public and be entirely transparent. They could enable us to understand what part of the error is due to which specific unusual behaviour and open up new paths to solutions and account for this possibility in the future.
Several analysts have pointed to the absence of a “likely voter model,” which has been employed in several countries. While this model might appear to be useful, some experiences with it suggest it is not a cure-all. Pollsters who tried to use the model in the 2013 British Columbia election and the 2014 Ontario election concluded that it decreased the quality of the prediction. After the 2017 presidential election in Chili, analyses showed that all the estimates that used the model were less accurate than those that used the whole sample.
It is important to recognize that no single hypothesis of voting behaviour can entirely explain the gap between the polls and the election results. Furthermore, all independent analyses of polling errors, including those during the 1998 Quebec election, have concluded that the main cause is in sampling bias. However, sampling bias is difficult to study and more difficult to correct.
Despite what we might think, polls do not often get it wrong. In addition, research has shown that the errors in prediction have lessened over time. Widespread media coverage of cases of errors reinforces the impression that polls often get it wrong. But the history of surveys reveals that when polling errors have been carefully studied, this always results in improved methods, in addition to encouraging greater caution.
This article is part of the 2018 Quebec Elections feature.
Photo: Coalition Avenir Québec supporters watch the election results on a giant screen showing party leader François Legault, on October 1, 2018. The Canadian Press, by Paul Chiasson.
Do you have something to say about the article you just read? Be part of the Policy Options discussion, and send in your own submission. Here is a link on how to do it. | Souhaitez-vous réagir à cet article ? Joignez-vous aux débats d’Options politiques et soumettez-nous votre texte en suivant ces directives.