

It has been 20 years since economic issues were at the forefront of a Canadian federal election campaign. In 1988, the debate on free trade with the United States accounted for most of the policy coverage reported by media. Since then federal elections have been mainly driven by conversations about government accountability, national unity and the enduring frame of a strategic “horse race” between parties and leaders. One of the key differences between 1988 and 2008 is that none of the main party leaders in this campaign was prepared for the almost complete domination of economic issues. Indeed, it became a campaign about the economy to an extent that none of the main parties or leaders quite seemed prepared for. But perhaps the definitive contrast between 1988 and 2008 is that the media spotlight on the Liberal Party (and particularly its leader) had faded considerably.
As we shall see, though, the tone of this campaign was also markedly different. In media coverage, Stephen Harper and the Conservatives may have prevailed in this campaign partly as a function of receiving significantly more press coverage than the other parties and party leaders. But their success media-wise seems to have been limited: coverage of the Conservatives was increasingly negative relative to that of their opponents. Negative coverage for the Conservatives was apparently not so bad, though; and the sheer volume of Conservative coverage overwhelmed the other parties in a way that certainly has not been evident for any party in the past two elections. One challenge ahead for all parties and leaders may be how to respond to and prepare for this peculiarly Conservative- and Harper-focused media environment.
The sheer volume of Conservative coverage overwhelmed the other parties in a way that certainly has not been evident for any party in the past two elections.
The 2008 federal campaign officially kicked off on the morning of September 7. Our analysis of media content begins several days earlier, on September 3, during the period when election speculation in Ottawa began in earnest. The study, then, spans the entire campaign — for 42 days in total — concluding on October 14, election day. This is the third instalment of our federal election content analysis, extending our previous efforts in 2004 and 2006. While analysis of past campaigns was performed manually by human coders actively reading the newspapers, the 2008 analysis relies entirely on a new automated content analytic procedure.
The automated method relies on dictionaries of categorical keywords, which are currently available only in English. As a consequence, our 2008 study covers only English-language press. The sample includes the same English-language newspapers as in 2006 and 2004, The Globe and Mail, National Post, Toronto Star, Vancouver Sun and Calgary Herald. To that group, we have added the Montreal Gazette and the Ottawa Citizen, which replace Le Devoir and La Presse in terms of volume though clearly not in terms of content. There are some gaps in regional coverage, then, and we now lack French-language Quebec media entirely. Our results should thus be regarded as an accurate, but partial, picture of Canadian newspapers’ coverage of the 2008 election.
The study includes every story from the main news sections of each of the seven dailies that mentions the federal election or any of the parties or party leaders. In total, just over 4,050 articles were analyzed including news stories as well as editorial and opinion pieces. The content analysis captures party, leader and issue prominence, as well as the tone of coverage about parties and leaders. For each newspaper, we use a computer-based procedure that relies largely on simple text-based searches.
Topic coding reflects the issue salience or policy focus of a campaign. In previous studies, human coders manually recorded the first three topics mentioned in each article. Here, the automated procedure calculates topic codes using a dictionary of keywords for each major policy domain. If an article mentions at least three keywords for a given policy topic, we assume the article has some content dealing with that topic. Based on this procedure, then, our election issue analysis reflects the percentage of articles that discuss, at least in passing, a given topic.
The study also tracks the total number of mentions of all major parties and leaders, as well as the placement of each mention. To identify the first party or leader mentioned in an article, we automatically count characters from the beginning of the article, directly replicating the manual coding of first mentions in our previous studies. First mentions provide valuable information about the relative salience of parties and party leaders during the campaign; they are indicative of the way in which the campaign is being framed, and point to which party or leader is effectively driving coverage.
The automated content analysis thus tracks the volume and prominence of coverage allocated to the main parties and leaders, as well as trends in issue salience, efficiently and systematically. It also includes one final set of codes for the tone of coverage of parties and leaders. The automated method we use to analyze tone is well established in social science literature. Tone of coverage is determined by the relative frequency of a pre-defined list of sentiment-bearing words in a selection of text. Our tone dictionary is derived from several of the most well established and comprehensive lexical resources available for sentiment analysis. The dictionary is composed of an expansive list of words (including inflected word forms and common idioms), all annotated for positive or negative valence. Sentiment classification is much more challenging than identifying topic and actor mentions, of course, since tone tends to be more dependent on the relation between words. To determine the tone about particular actors, then, we apply simple lexical rules to account for the proximity of keywords in the tone dictionary to actor references. This requires some discussion, of course, a brief version of which we include here. (More detailed methodological information is available at https://mediaobservatory.mcgill.ca.)
The automation procedure for tone begins by identifying all sentences in which any of the major parties or leaders is mentioned and then counting the number of positive and negative words in those sentences. To generate the measure of “net tone,” by article, we subtract the number of negative words from the number of positive words, taken as a proportion of all words in sentences mentioning a given party or party leader. The result is a measure of tone for each actor, in which a score of zero reflects neutral coverage, positive scores indicate increasingly positive coverage, and negative scores indicate increasingly negative coverage. In these data, the resulting measure ranges from roughly -30 to +30, reflecting articles in which as many as 30 percent of the words in sentences about a given party or leader are negative or positive. Because the vast majority of articles are neutral, however, a weekly average for net tone reflects a much narrower range. Trends are apparent even using that measure, though for the sake of simplicity we use data here in which articles are assigned to one of three categories: negative (“net tone” of less than -2), positive (“net tone” of more than +2) and neutral (all others).
Note that given the expansive nature of the tone dictionary, this measure reflects a combination of content about the issues and events being reported on, and the opinions or attitudes expressed about the content itself. To be clear: party or leader tone can result from attention to campaign gaffes and policy failures, or from criticism of campaign platforms. Thus, tone of coverage is a summary measure of the relative negativity of the events or issues being covered and the opinions and attitudes of newsmakers.
That is the 2008 study, then; what were the results? First, press coverage during this campaign was dominated by economic issues. The economy figured in more than one-fourth of news reports about this campaign. Indeed, if we combine mentions of finance, commerce and employment in this category, economic issues were featured in about 50 percent of election related news articles. (Note that, as usual, a large proportion of the articles printed during this election were about strategy and the horse race between parties and leaders. It is thus especially striking that the economy figured so prominently in the supply of election news about this campaign.)
The environment was the second most salient topic. Even appearing in nearly 20 percent of articles over the campaign (including both environment and energy), however, it trailed the economy by a rather wide margin. This is surprising given the pre-election salience of the issue, and given that the “Green Shift” policy was the centrepiece of the Liberal Party campaign. Moreover, as we shall see, the Green Party figured more prominently than ever in news media. Despite these factors, environmental issues appeared in fewer than 2 of every 10 articles printed about this campaign. Moreover, the prominence of the environment issue declined, slowly but steadily, as the campaign progressed.
The “Green Shift” policy was the centrepiece of the Liberal Party campaign.
Foreign affairs, crime and arts funding were the next most salient issue domains in the press, appearing in about 18 percent, 12 percent and 10 percent of election stories respectively. Much of the foreign affairs coverage concerned Canada’s ongoing military commitment (and the cost associated) to the Afghanistan mission. Crime policy was highlighted by coverage of the Conservatives’ proposed changes to the Youth Criminal Justice Act, and arts funding attracted media attention in response to Conservative campaign announcements.
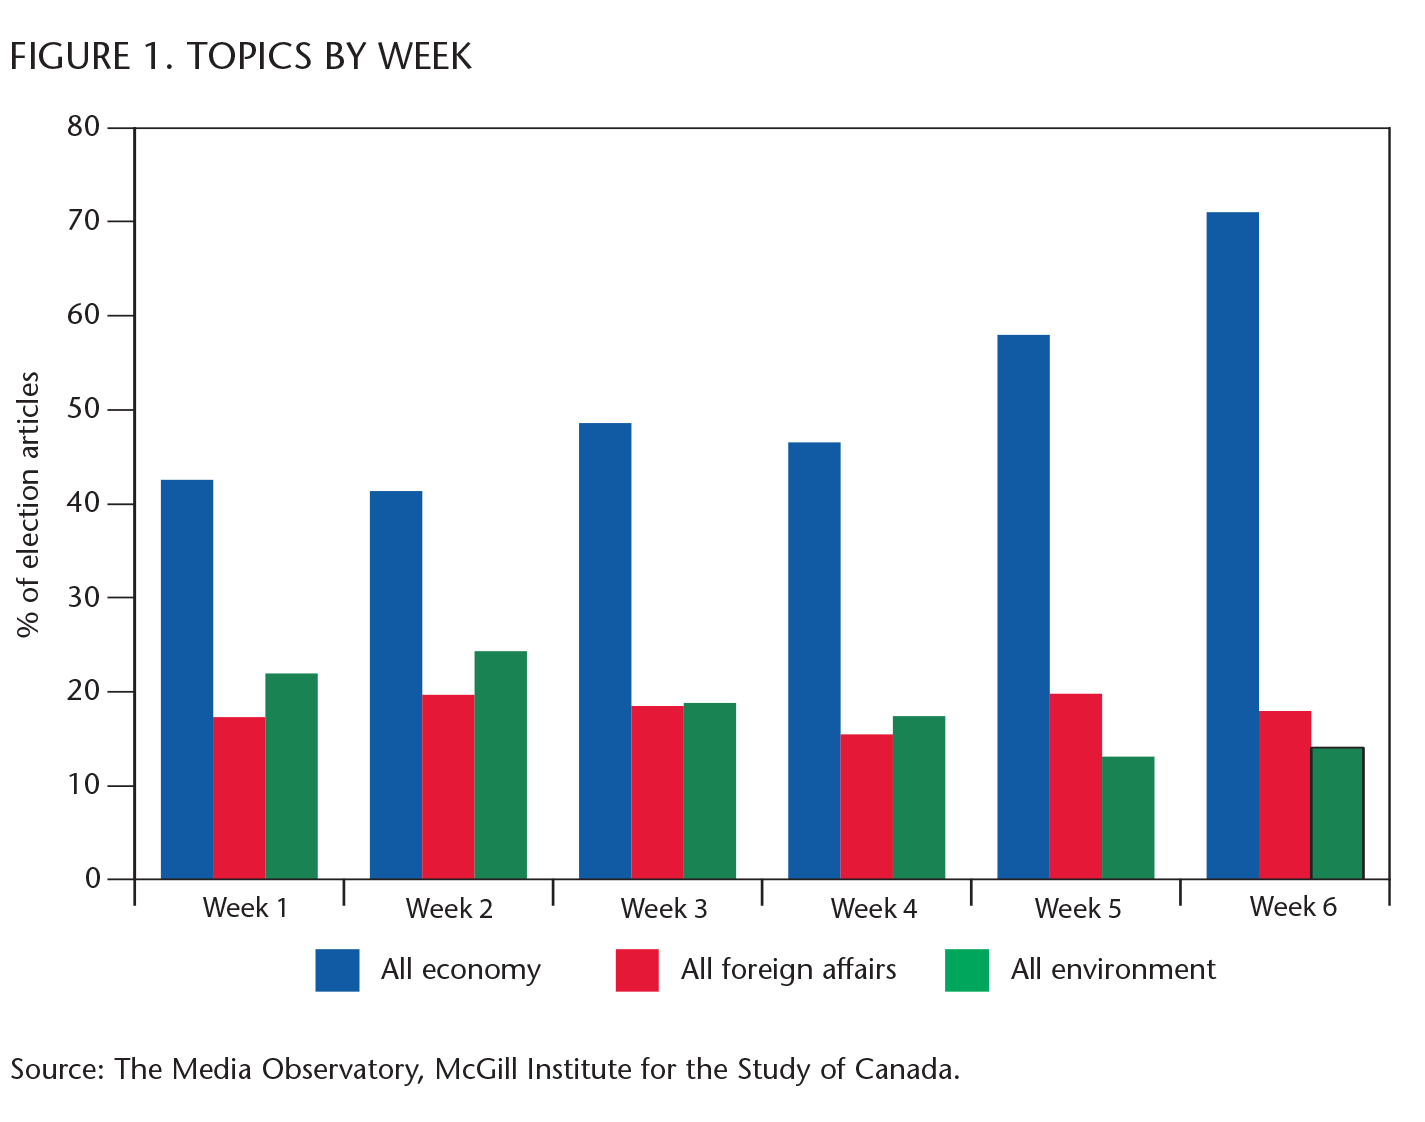
The shifting issue focus of the campaign is illustrated in figure 1, which tracks weekly coverage for “all environment” stories (combining environment and energy), “all foreign affairs” (combining foreign affairs and international trade), and “all economy” (combining economy, employment and financecommerce). The figure shows not just the slow decline in environment stories, but the rather striking prominence of the economy, which steadily assumed control of the media agenda as this campaign unfolded. During the week before the official kickoff at Rideau Hall, economic issues already figured in roughly 4 in 10 news reports related to the looming election. But by the final week of the campaign, the economy was clearly at the forefront of the press’s attention. Indeed, in the week leading up to voting day on October 14, economic issues were mentioned in more than 70 percent of articles about the campaign.
There can be little doubt that the increasing coverage of the Canadian economy was directly related to concerns about the financial crisis in the United States that emerged during the campaign. In some ways, then, the 2008 Canadian campaign looked a lot like the famous FTA campaign 20 years ago — the 1988 campaign was also dominated by questions about the economy, and especially the consequences of the Free Trade Agreement with the United States. There are some fairly stark differences between 1988 and 2008, however (and not just that the ’88 election was about trade rather than the domestic economy). For instance, in 1988 the main parties and leaders all anticipated and primed the economy frame. It is not clear that the economy’s presence as the critical ballot box question in 2008 was either anticipated or welcomed by any of the parties or leaders contesting this campaign.
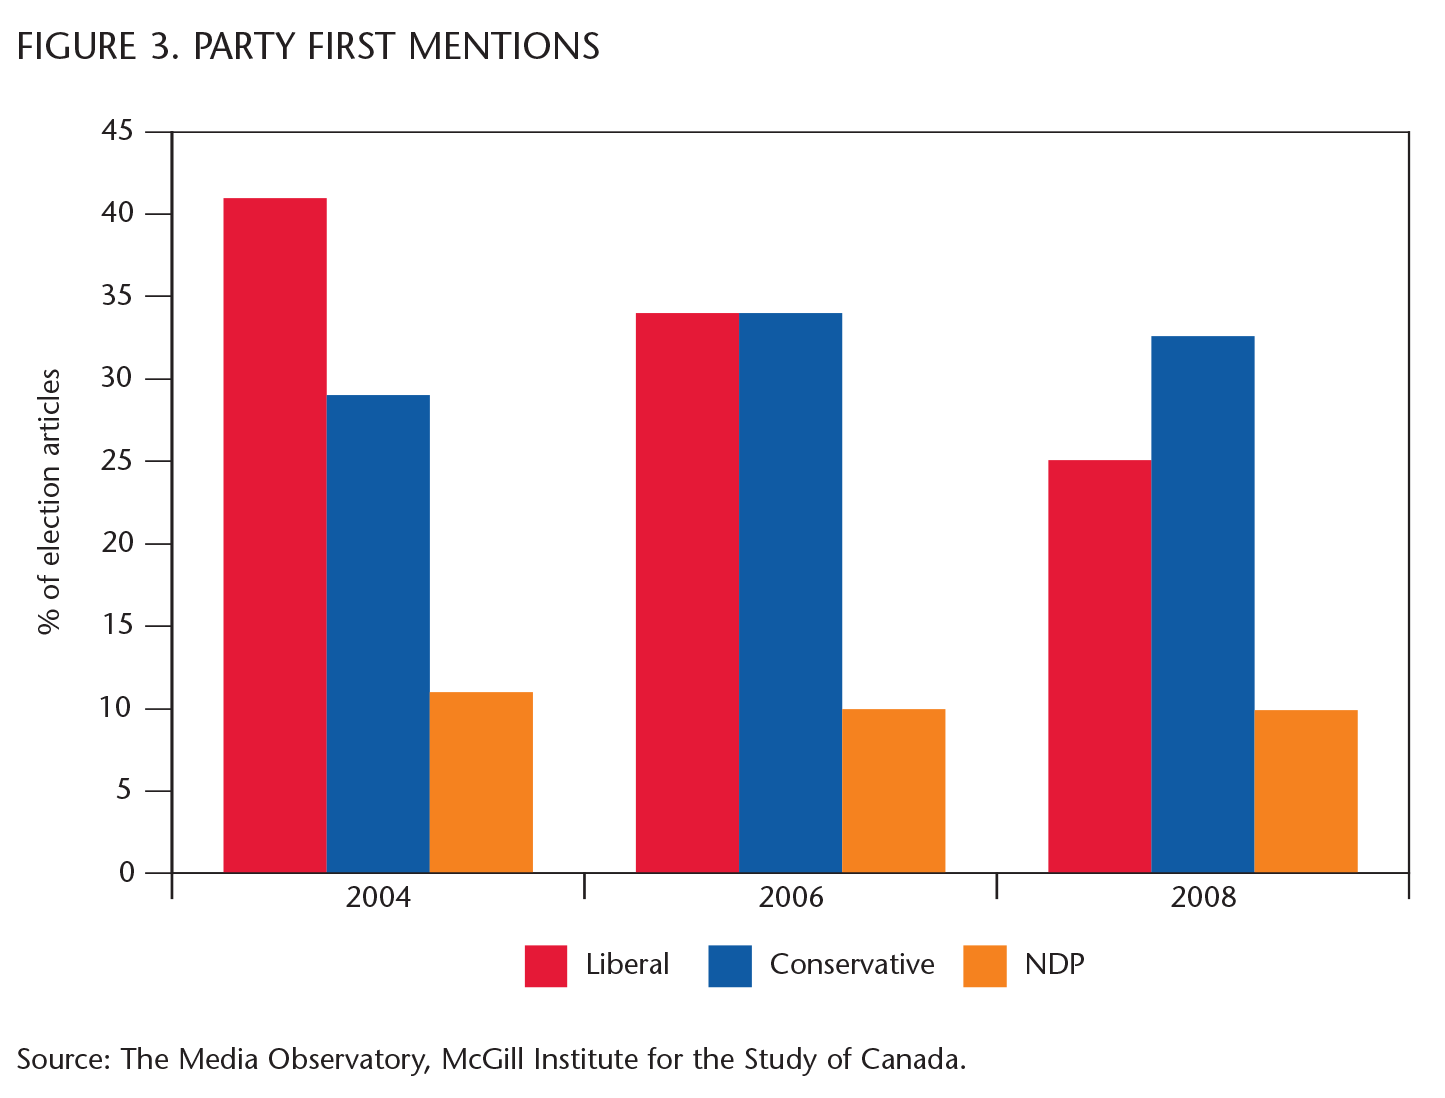
Another unique element of 2008 campaign coverage is the salience of parties and leaders. To capture this, we rely on “first mentions” — the party or leader mentioned first in each article. First mentions indicate who is framing the election campaign — whether the article is about Harper and reactions to Harper, for instance, or, alternatively, about Dion and reactions to Dion. Figures 2 and 3 show that 2008 was clearly about the former.
Unlike his predecessor Paul Martin, Liberal Party leader Stéphane Dion did not dominate the news agenda in 2008. The declining prominence of the Liberal Party’s leader is quite remarkable. In 2004, almost half of the news stories in the Canadian press about leaders mentioned the Liberal Party leader first. In 2008, Dion was the first leader mentioned in articles only about 15 percent of the time. This marginalization by mainstream newspapers occurred in spite of his position as leader of the opposition and of the second-largest party in the country.
Most of the articles concerning party leaders were led by coverage of Conservative leader Stephen Harper. In fact, articles that began with Harper outnumbered all articles beginning with the other party leaders combined. Where headlines were concerned, the gap was even larger. That is, for Canadians skimming headlines, in both local and national newspapers, Harper was even more predominant. Strictly in terms of the proportion of coverage, Harper was mentioned three times as often as Dion by the end of the campaign.
Party salience was also considerably different in 2008, although the shift was not as dramatic as it was for leaders. Once again, though, note in figure 3 the consistent decline in the Liberal Party’s share of the media spotlight during the three most recent campaigns. In 2004, more than 40 percent of articles that involved a party mentioned the Liberals first. By 2008 the Liberals accounted for only one-fourth of first parties mentioned. They have unquestionably been supplanted by the Conservatives as the most salient party in the campaign. Some of this shift may be a function of incumbency, of course — it may be that the party of government always has an advantage where campaign framing is concerned. Note, however, that the salience of the Conservatives has been relatively consistent since 2004, hovering around 30 percent of first party mentions. While the prominence of their leader, Stephen Harper, has risen considerably, the Conservative Party brand has not become more salient in press reports since 2004. The shift in party standings is due not to a rise in Conservative mentions, but to a decline in Liberal ones.
NDP and Green Party leaders were also treated differently in terms of prominence in 2008. Jack Layton’s salience in newspapers has declined over time. His zenith appears to be in 2004, when he was mentioned first in about 12 percent of articles. The 2008 coverage of the NDP shows that Layton was much less prominent in the press. Only about 6 percent of articles led off with reference to the NDP leader specifically. Indeed, in the first few weeks of the campaign the Green Party was featured more prominently in the press than the NDP. This was clearly a breakthrough year in terms of press coverage for the Green Party and its leader Elizabeth May. Overall, almost 5 percent of press articles during the campaign mentioned May first, remarkable considering that her predecessor Jim Harris was mentioned first in only a tiny fraction of stories during the previous two federal campaigns. How were these changes in the prominence of parties and leaders in 2008 related to the tone of coverage? After all, prominence in the press does not necessarily mean positive press coverage. In 2004 and 2006, for instance, Paul Martin was the most prominent leader, yet he was also the leader who received the most negative coverage. Stephen Harper received much better coverage in those elections, though he appeared in far fewer articles than Martin did.
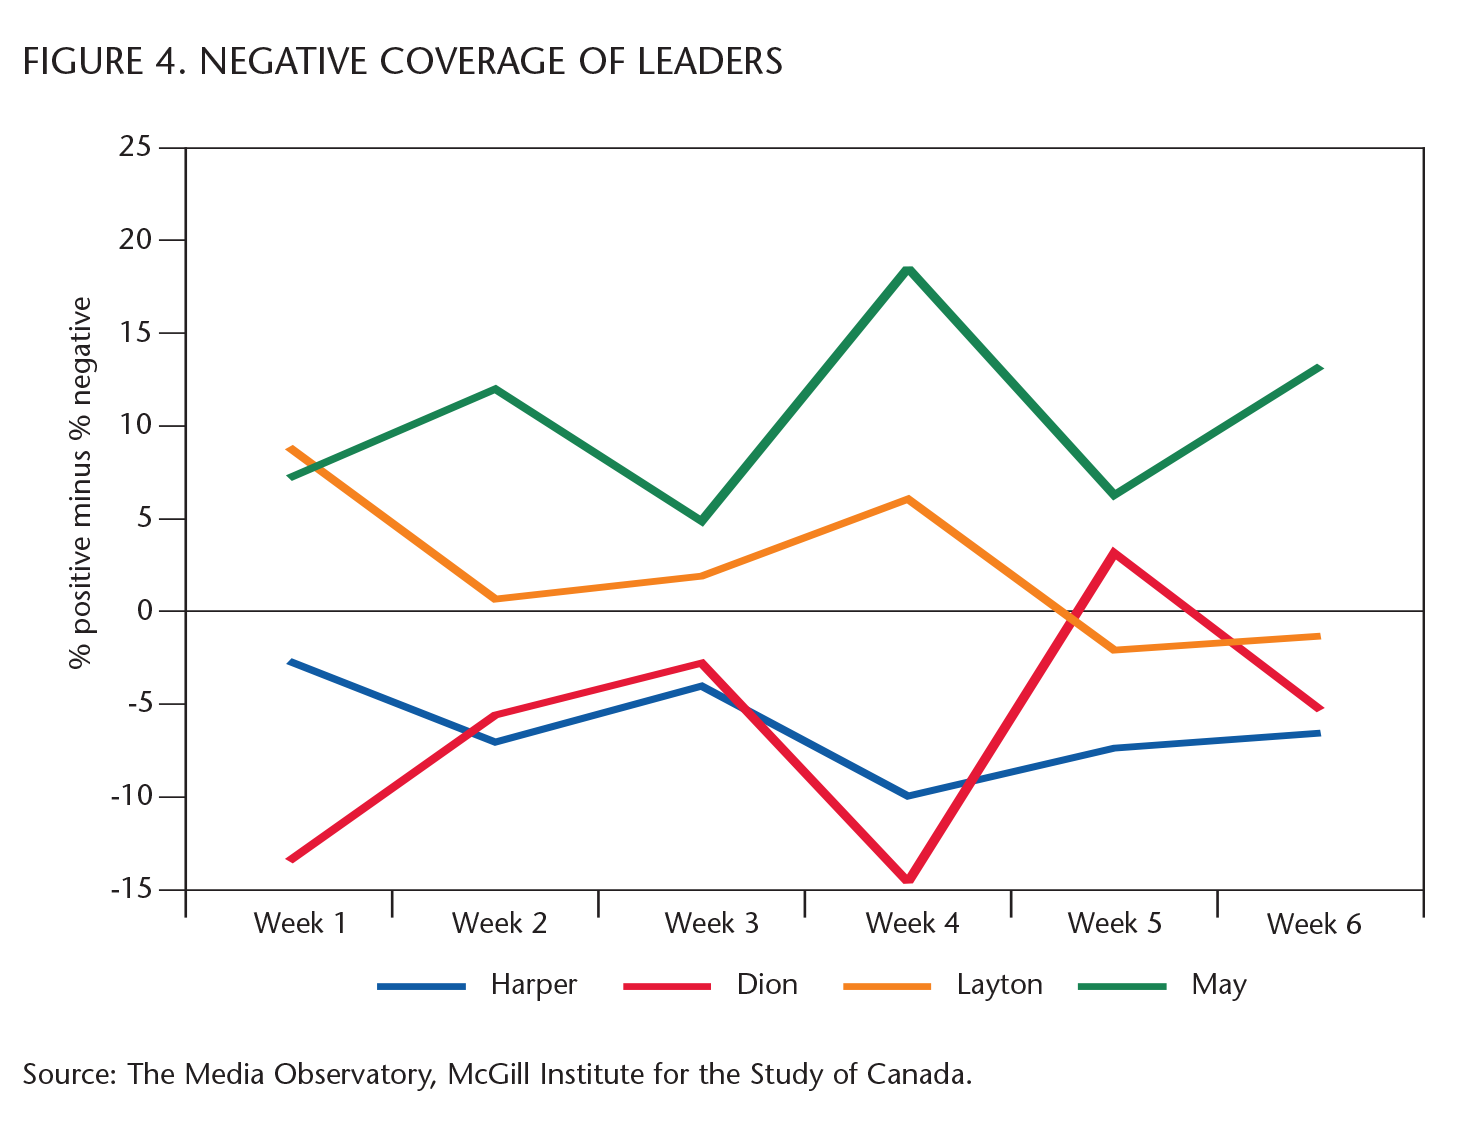
A key difference in 2008 relative to previous campaigns is that the Conservatives and their leader received rather more negative coverage than they have been accustomed to. Figures 4 and 5 illustrate trends in tone. Both figures rely on a relatively simple version of average net tone: the percentage of positive stories minus the percentage of negative stories for each party and leader. But to focus on inter-party differences (and also filter out the effects of shifting issue coverage on our automated tone measure), figures 4 and 5 show the weekly difference between party/leader tone and the average of election tone for that week’s coverage of all main parties or leaders combined. The interpretation is as follows: a Liberal Party value of -12 in week 1 reflects the fact that Liberal net tone was 12 points worse than the party average for that week. Note that these automated results are not directly comparable with our manual data from past elections; they nonetheless provide a reliable indication of trends, both over time and across parties, in the 2008 campaign.
Overall, net tone was as negative for Harper as it was for Dion. Combining all six weeks, Harper’s net tone was 6.3 points below the average, compared with -6.4 for Dion, +2.3 for Layton and +10.3 for May. (We do not deal here with net tone for Bloc Québécois leader Gilles Duceppe, since we are looking at English-language papers only. What data we do have for Duceppe thus do not reflect his coverage for the vast majority of the BQ constituency.)
Differences across parties are relatively similar. Conservative net tone over the campaign was 4.7 points below the cross-party average, while for the Liberals it was -4.9; for the NDP it was above 0.1 the average. Once again, the Green Party benefited most from newspaper coverage. The overall net tone for the Green Party was 9.7 points above the average. In short, if a story mentioned the Greens, or Elizabeth May, chances were high that coverage was framed in positive terms.
The most interesting trend over the campaign is the absence of any considerable gap between the Conservative and Liberal parties. Indeed, in the final week of this campaign the Conservative Party and Stephen Harper received the worst coverage in the major newspapers. But in spite of the Liberals’ comparatively rough start, from week 2 onwards there is rarely much noticeable difference in the tone of coverage for Liberals and Conservatives, or for Dion and Harper.
This trend in media coverage nicely captures what voters observed in both opinion polls and election commentary over the campaign. The Conservatives began with an advantage over the Liberals in terms of positive versus negative coverage. This advantage faded quickly in the first part of the campaign, however. That the Conservatives were unable to reopen a gap between themselves and the Liberals as the campaign progressed proved to be rather important. To be sure, the volume of Conservative coverage was extraordinary. But the tone was, relative to their main competitor, rather middling.
What do these results tell us about the 2008 election? They certainly highlight the increasing significance of the economy over the campaign. To the extent that the campaign provides some kind of mandate, it is clear that the next government is supposed to deal with the economy. Results also illustrate what appears to be a failure on the part of the Conservatives — a failure, that is, to fully capitalize on the sheer volume of Conservative Party and especially leader coverage. This was clearly a campaign in which media coverage focused on the Conservatives. This was not driven by what appears to be overly critical media — certainly, coverage was no more critical than it was for the Liberals. But at no point once the campaign was under way were the Conservatives or Prime Minister Harper able to garner markedly better coverage than the Liberals or Dion. The consequence was, perhaps, that while the Liberals clearly did not win the election, the degree to which the Conservatives did was rather limited.