


Much of Canada’s wealth and well-being is attributable to its success as a trading nation; in particular trade with the United States. The characteristics of the two economies and the trade flows between them provide important context for discussions on developing a national clean energy strategy for Canada. The Clean Energy Dialogue embarked upon by Canada and the United States testifies to this importance. On the one hand, because of the high level of trade integration between the two countries, climate and energy policy choices in the US have both economic and environmental implications for Canada. Differences in policies can lead to competitive advantages for firms in one country.
On the other hand, Canada and the US have different energy sources, emissions profiles, forecast rates of emissions growth, and costs of reducing emissions. While there are obvious complementary elements, crafting a Canadian clean energy strategy that will integrate economic, environmental, social and regional factors suggests that a uniquely Canadian policy approach — complementary but different — could best meet our needs.
The US is the largest market for Canadian exports and the largest single source of Canadian imports. In 2008, over 77 percent of Canadian exports were destined for US markets. The US is the primary destination for Canada’s largest exporting sectors, including our energy and agriculture sectors.
The US accounts for around 65 percent of Canadian imports; the leading sectors are automobile manufacturing and parts, followed by the aerospace industry and the oil and gas sector.
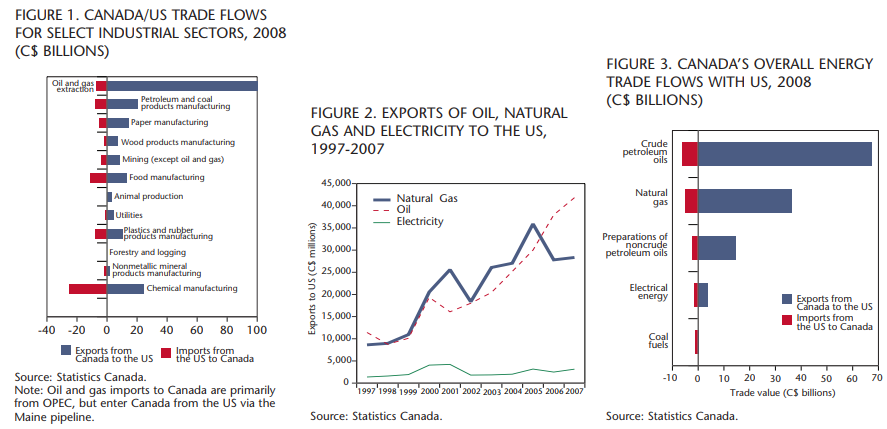
Figure 1 depicts the exports, imports, and trade balance between Canada and the US, by sector.
In 2008, Canada had major trade surpluses with the US in oil and gas extraction, petroleum and coal products manufacturing, paper manufacturing and wood product manufacturing. Canada’s exports to the US are significantly less diverse than the US’s exports to Canada. The oil and gas industry is now the largest source of Canadian exports to the US, having nearly doubled in value over the last five years. The automobile manufacturing sector is a distant second. As recently as 2004, however, the reverse was the case, with some $56 billion in automobile exports to the US compared with $52 billion in oil and gas exports.
The value of automobile exports has steadily declined in recent years, dropping approximately 35 percent to its current level of around $36 billion, reinforcing the central importance of energy trade to Canada’s economic wealth. The value of Canadian energy exports to the US has grown substantially in the past decade. Oil exports now total more than $40 billion a year, while natural gas exports are more than $28 billion a year. As shown in figure 2, this growth is primarily due to an increase in oil and natural gas exports (and rising prices for these commodities). Revenues from electricity exports have, in contrast, remained relatively flat over the same period, in the range of $1 billion to $4 billion per year.
Canada’s overall trade balance with the US in energy commodities is positive for all fuels except for coal, as illustrated in figure 3. Canada imports more coal from the US than it exports, despite the fact that its overall trade balance with the rest of the world in that commodity is positive. By far the most significant trade surplus from the energy trade for Canada comes from exports of petroleum products.
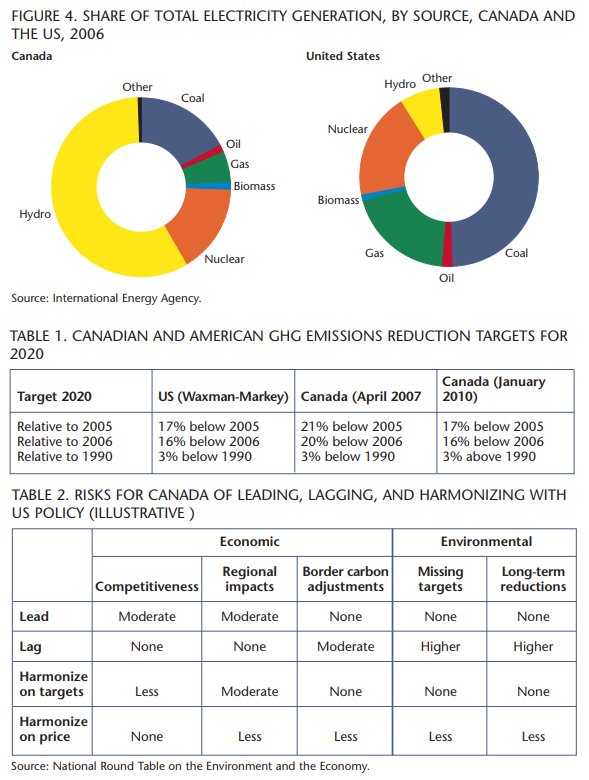
One key difference between the energy systems of Canada and the US is the composition of energy sources used for electricity generation. As indicated in figure 4, in 2006 the majority of electricity generated in Canada came from hydroelectricity. Canada is the world’s second largest producer of hydroelectricity, following China. This abundance of hydropower means that Canada depends much less on coal-fired power plants for electricity than many countries do — the US included. The US derives significantly more electricity from coal than Canada does. The US also uses more natural gas for electricity generation.
The value of Canadian energy exports to the US has grown substantially in the past decade. Oil exports now total more than $40 billion a year, while natural gas exports are more than $28 billion a year.
However, this abundance of hydropower does not necessarily translate into an advantage across all regions in Canada. In Ontario, for example, the provincial government maintains that it will close its four coal-fired plants (Atikokan, Lambton, Nonticoke and Thunder Bay) by December 31, 2014, citing environmental and health concerns. The government plans to replace coalfired capacity with natural gas, nuclear, hydroelectricity, and wind, along with increased conservation measures. At present, coal provides about 16 percent of Ontario’s electric power. In the National Energy Board’s 2009 reference case, the retirement of Ontario’s coal-fired facilities is offset by increases in coalfired plants elsewhere in the country — notably in Alberta and Nova Scotia. As a result, Canada’s coal-fired generation rises modestly, from about 106 billion kilowatt hours in 2006 to 128 billion kilowatt hours in 2030.
These differences have obvious implications for any clean energy strategy. On the one hand, the US can achieve very large emissions reductions by replacing its coal-fired electricity plants with less carbon-intensive alternatives, while Canada requires a broader range of measures across multiple sectors to reduce emissions. On the other hand, electrification in Canada provides greater emissions reductions due to the lower emissions intensity of electricity generation. In the short term, Canada’s low carbon generation provides it with a potential longer-term competitive advantage if Canada and the US implement climate policy that puts similar prices and stringent controls on carbon emissions.
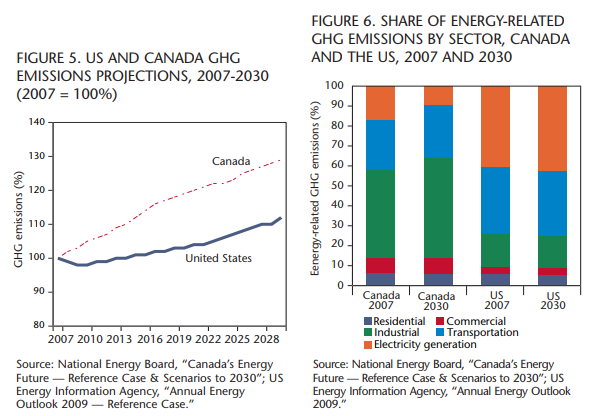
The federal government has recently indicated its intention to harmonize Canada’s climate policy with that of the United States, increasingly on all elements. This has implications for both the ambition and pace of climate policy development and implementation here in Canada. Already, GHG emissions targets in Canada have been moderated to line up with less stringent proposed US targets, at 17 percent below 2005 levels by 2020. Table 1 compares Canada’s recent and current GHG emissions reduction targets for 2020 with those of the United States.
Yet US ambition and timing on the climate file remains unclear and uncertain. Early momentum in Congress with the Waxman-Markey Bill, together with various Senate bills, has stalled. A federally mandated cap-and-trade system that could link with Canada remains in limbo. Clean energy technology discussions have not yielded specific results. Recent tailpipe emission standards harmonization is the sole substantive element. What overall “harmonized” Canadian-American climate policy actually will look like is not yet settled.
An inevitable question for Canada will be whether and how it does something on climate policy while the US does nothing and delays persist south of the border. National Round Table on the Environment and the Economy (NRTEE) reports in 2008 and 2009 demonstrate that an early, economywide carbon price signal is the most cost effective means of meeting deep GHG emissions reduction targets. Delay is costly as the carbon price will have to rise to meet stated targets in a shorter time frame. Like all countries, Canada will seek to implement policies that achieve the most GHG emissions reductions at the least economic cost. A core issue for the development of a clean energy strategy for Canada will therefore be whether it takes action on climate policy objectives now, or only at a later date pending US action.
For Canada, there are both risks and opportunities in US climate policy and its impact on Canadian energy and climate policies. Table 2, developed by the NRTEE, illustrates the types of trade-off risks at play from both an economic and environmental perspective in contemplating various leading, lagging, or harmonizing scenarios for Canada. They include competitive sectoral impacts, regional distribution impacts, application of border carbon adjustments, and missing both medium-term (2020) and longer-term (2050) targets. It offers a way to contemplate optimal Canadian policy design to minimize risks. No option is risk-free — including harmonization — and there are inescapable costs to all options. The table is illustrative only at this stage; Canadian policy choices and responses will ultimately determine the likely level of risk.
A core reason for these underlying risks is the different expected rates of growth in GHG emissions in the two countries. This is reflected in figure 5, which shows the percent increase in GHG emissions over 2007 levels as predicted by current business-as-usual projections for Canada and the US. Canada’s emissions in 2006 were 22 percent above 1990 levels, while those of the US stand at 15 percent above 1990 levels.
Higher emissions growth in Canada is principally a result of the forecast continued growth of the Alberta oil-sands. Oil production (including oil sands) in Alberta relies primarily on electricity generated from coal. As oil sands production is electricity-intensive, this translates into greater overall GHG emissions growth in Canada, suggesting that a greater level of effort (and likely higher carbon prices) will be needed to reduce emissions and meet the newly stated targets in Canada than will be needed in the United States. This means a higher marginal abatement cost curve for Canada, although the exact shape between now and 2020 will depend on whether Canadian policy seeks to align only on quantity (targets) or on price, as the NRTEE’s forthcoming report on Canada-US climate policy, Climate Prosperity, illustrates.
From a sector-level perspective, two distinct differences between the countries emerge. First, Canada’s access to hydroelectric generation — as discussed above — greatly diminishes emissions from the electricity generation sector in Canada, relative to the US. Second, Canada’s industrial emissions account for a much higher share of overall GHG emissions than do industrial emissions in the US. Partly this difference is indicative of relatively fewer emissions from electricity generation in Canada, but it also reflects the emissions intensity of Canada’s economy, particularly the mining and oil and gas extraction sectors. Industrial emissions have shown strong growth in the past decade in Canada and are predicted to continue to grow in relative importance. As reflected in figure 6, by 2030, emissions from industry are forecast to account for nearly 50 percent of total GHG emissions in Canada — compared to around 15 percent in the US.
This growth in the Canadian industrial sector is important in the context of Canadian and US climate and energy policy, as highly traded and emissions intensive sectors (e.g., cement, aluminum) could face the greatest economic impacts from Canadian and US climate policy.
Key messages emerge from the emissions, energy, and trade contexts presented in this paper. First, Canada’s trade relationship with the US is vital for Canada’s continued wealth and prosperity. Driving this is Canada’s energy economy and valuable exports of oil, gas, and electricity products and services to the United States. Extensive trade, particularly in energy, highlights the integrated nature of the Canadian and US economies. As a result of these close trade ties, the impact of climate and energy policy in the US, and Canada’s response to it, will have clear cascade effects in Canada.
Second, differences between our two energy economies have significant implications for Canada’s ability to achieve the same GHG emissions reduction targets as the United States, to which we are now committed. Because Canada’s emissions are growing at a faster rate than those of the US, Canada will have to make a greater relative effort to reduce emissions. Ensuring this does not impact Canada’s future competitiveness and the growing contribution of our energy sector to national economic wealth and Canadians’ standard of living will be important.
Third, a national clean energy strategy and a national climate policy are clearly linked. Steps that align the two more deliberately will reap benefits over time in making inevitable GHG emission reductions more cost-effective and achievable.
Photo: Shutterstock