In my line of work, I regularly see people present graphs that look something like this:
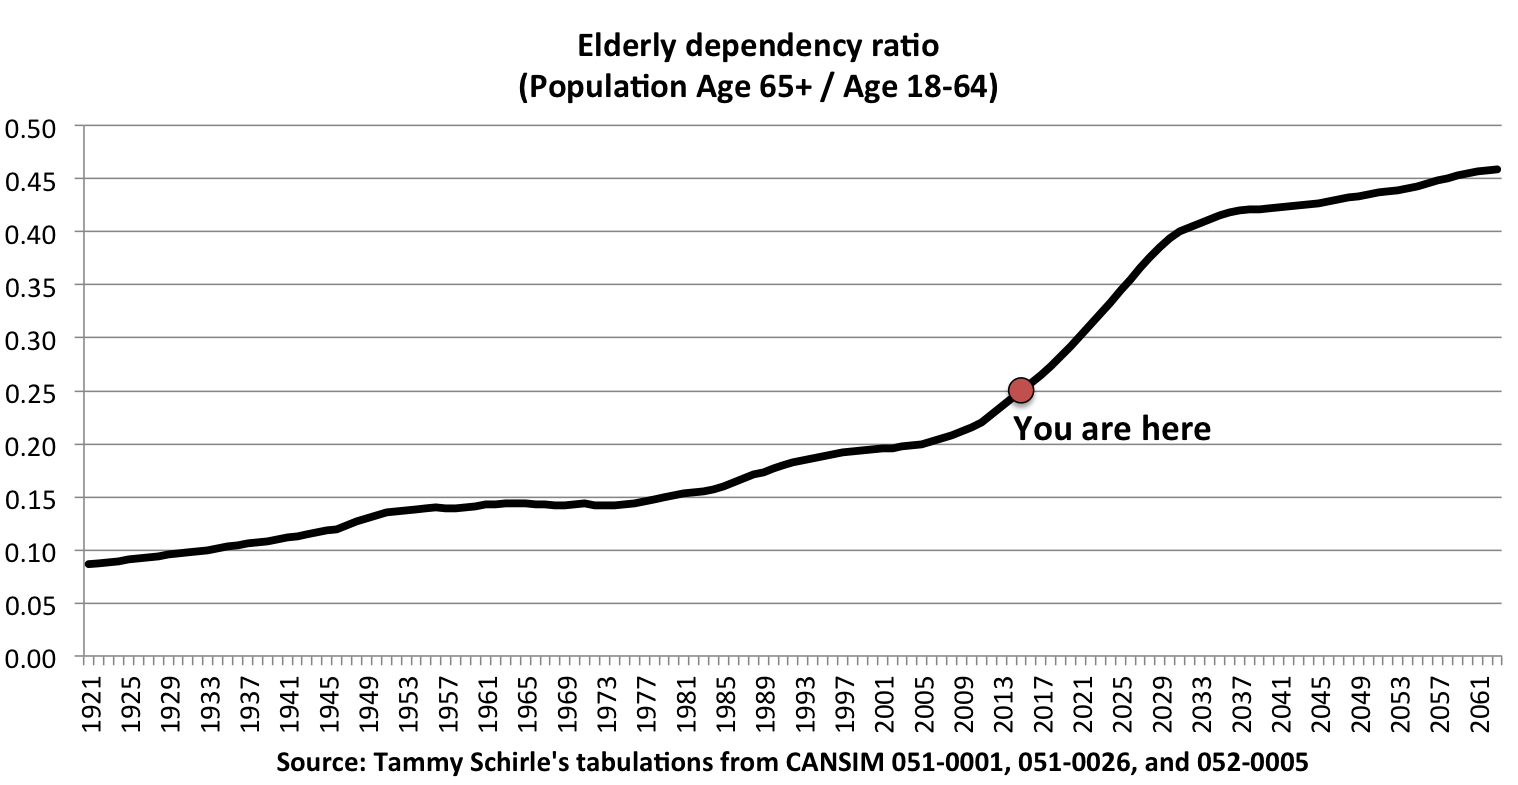
It looks scary. It’s usually meant to scare you, and it probably should (at least little). The ratio of the population over age 65 relative to the “working-age” population is growing, and will continue to do so.
On the upside, people are healthier and living longer yay! But at those older ages, folks likely aren’t working much, not paying much in taxes, and probably making some regular visits to the hospital emergency room. We have to think seriously about the debt we carry forward and how we might manage the changing demographics of Canada.
But thinking seriously about these issues requires much more context.
So, I put together a slightly bigger picture. We’ll start by looking at men. In the next graph I present the structure of the population by age group. In each year, you can see the portion of the population that is age 75-89 (in orange) has been growing and we can expect that to continue as life expectancy continues to increase.
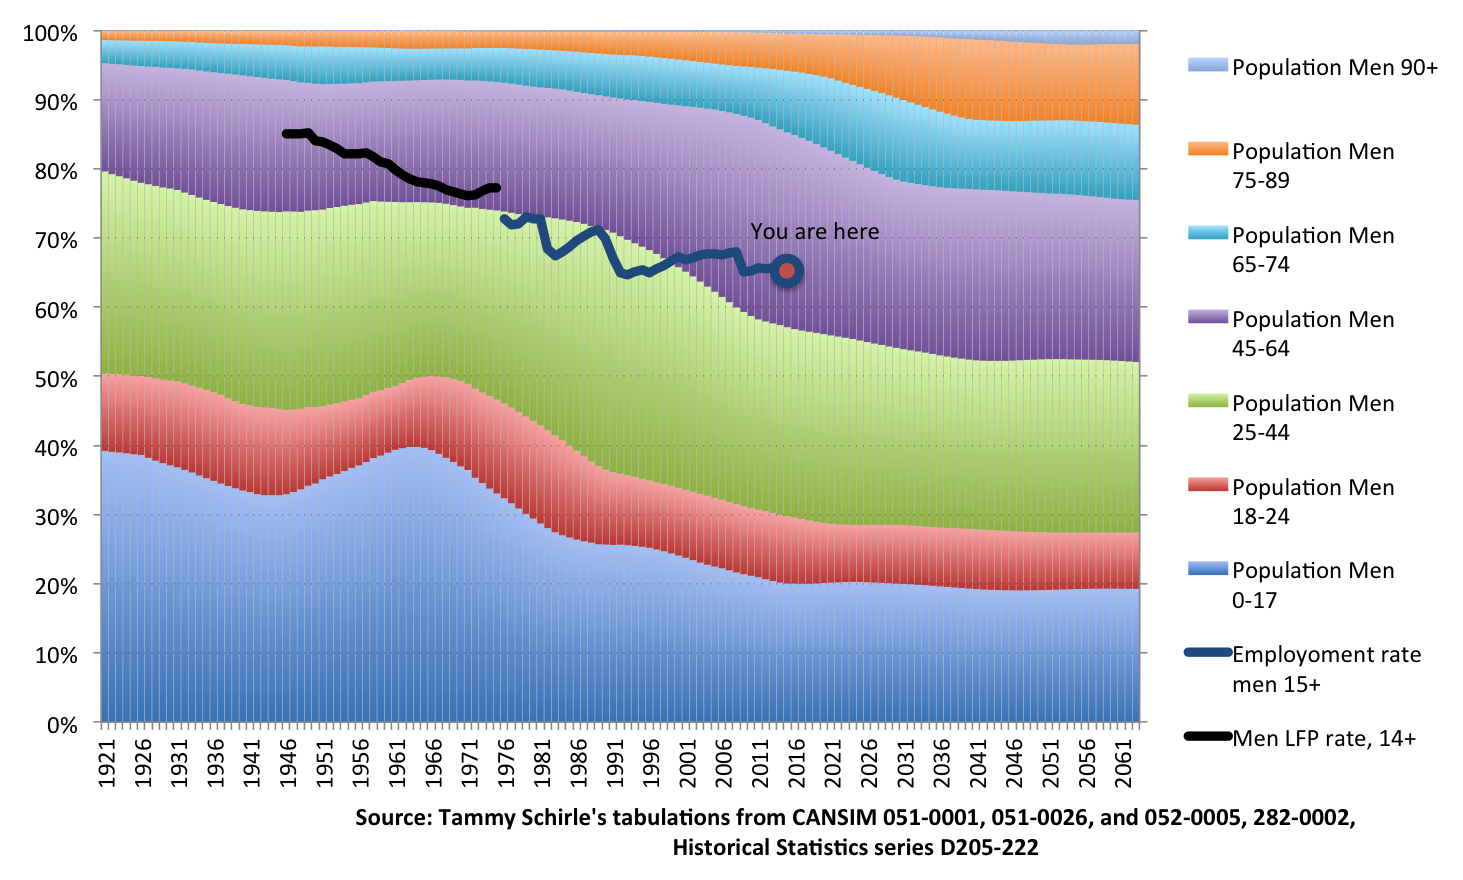
On top of that, I put men’s labour force participation rates from 1946-1975 and employment rates since 1976. Those have steadily declined. You can imagine projecting forward income tax revenues against major health expenditures…. Looks like we’re toast.
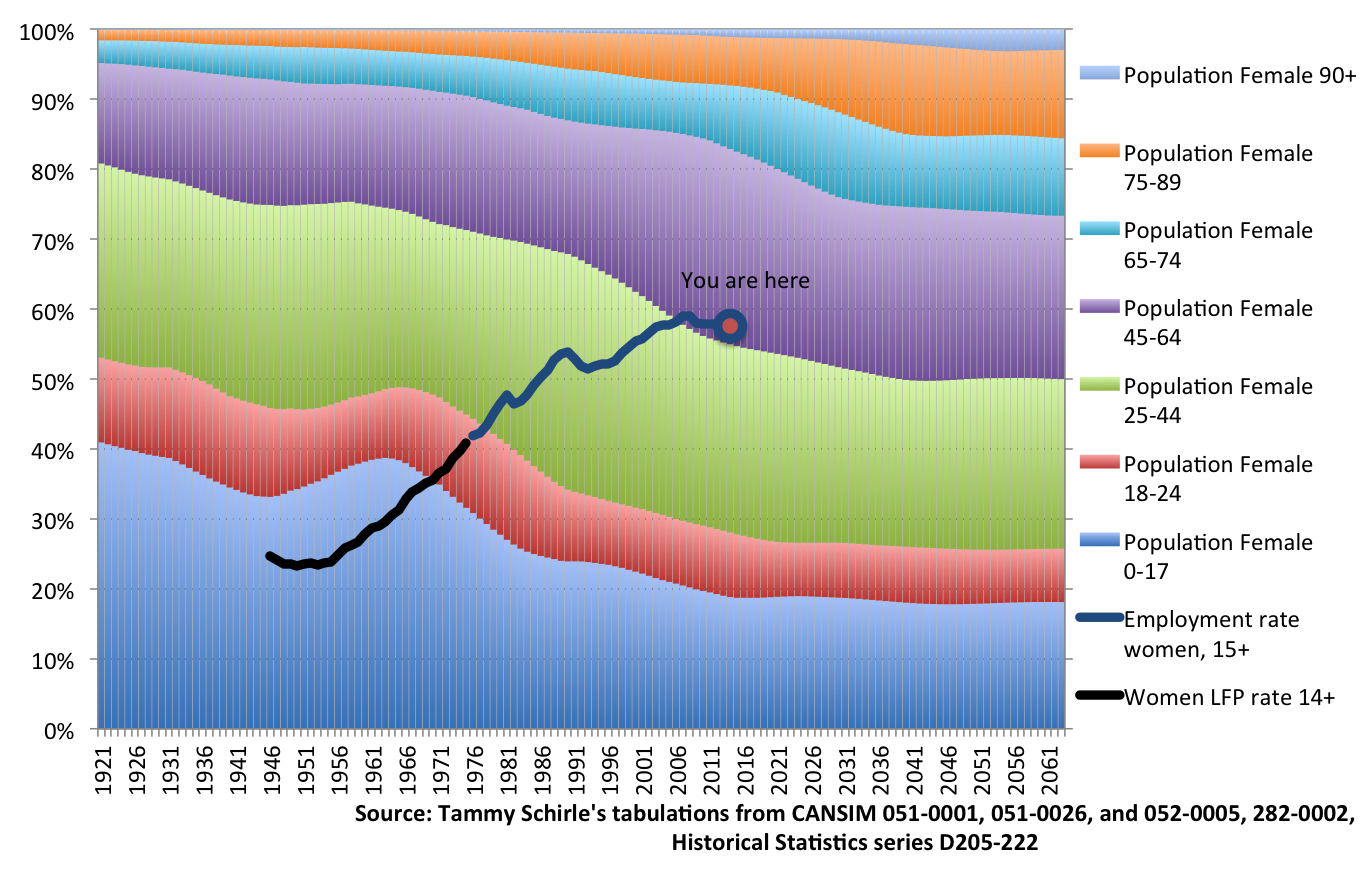
But then we look at women. The demographics are similar to men’s, except that women have been living longer. It’s women’s employment and labour force participation that stand out. Certainly, the `working-age’ portion of the female population was much larger in 1950s and 60s than it is today, but few of those women were actually working. Today, women’s employment rates are not much lower than men’s. This picture doesn’t seem nearly as bleak.
But what happens in the future? Who knows. As a starting point, we need to focus less on the size of the “working age” population and pay more attention to how many people are actually working. The graphs above have highlighted the capacity for women to work in the paid labour market, but there is great potential for many different groups of younger workers across Canada (and I’m not referring to the infamous overeducated Starbucks baristas).
Apart from younger workers, major changes are ongoing in the labour market for older individuals. In the 1990s, we were buying into (or trying to buy into) the Freedom 55 dream. But since then, the employment rates of older men and women have steadily increased. With better health at older ages, why would we expect retirement ages to remain the same? After all, I’m told age 55-69 is the new middle-age.