


Electoral reform is very much on the federal political agenda. Leading his Liberal Party to an impressive victory on October 19, 2015, Prime Minister Justin Trudeau committed himself to swift action on a democratic reform plan that would replace Canada’s current electoral system within 18 months. This would, he promised voters, be the last Canadian election under first past the post (FPTP): that is, under a system where a candidate only requires more votes than any other single candidate, not more than all the others put together.
The Liberals have promised to establish a special all-party parliamentary committee to study the various alternatives. Although it is impossible to predict what might result from those deliberations, one possible — even likely — outcome would be the alternative vote (AV) system, sometimes known as the “preferential ballot.”
AV is an attractive alternative to FPTP because it represents a significant but modestly incremental reform when compared with other alternatives, such as proportional representation or mixed member electoral systems. Like the current system, AV relies on electoral divisions that each elect a single member of Parliament. The difference is that candidates would have to earn a majority of the votes in order to be elected as MPs rather than the plurality (more than any other candidate, but not necessarily more than all others put together) that is currently required. In order to achieve this goal, an AV ballot asks voters to rank the candidates in order of preference rather than indicating a simple single preference with an X.
Once the polls have closed, first preferences are counted, and any candidate who has an absolute majority (more than 50 percent) of first preferences is declared elected. If no candidate has received a majority, then the candidate with the fewest first preferences would be dropped, and his or her ballots transferred according to the second preferences indicated on those ballots (or not transferred if no second preference is indicated). If this results in a candidate having a majority of the votes (first preferences plus transferred second preferences), then that candidate is declared elected; if not, the candidate with the next-lowest number of ballots is dropped and those ballots are now transferred. And so on, until a candidate has a majority of the vote, which may not happen until there are only two candidates left.
AV is not untested speculation; it has a fairly extensive history in Canada. It was used in provincial elections in Manitoba, Alberta and British Columbia during the first half of the 20th century. The Liberals and Conservatives currently use it for leadership elections within their parties. Ontario’s provincial government has announced it will allow municipalities to use AV for municipal elections starting in 2018.
But how might this work out in practice for Canadian national elections?
In order to understand how the results of the 2015 election might have been affected by AV, we started with the 2015 election results as reasonable approximations of AV “first preferences.” This assumption is slightly problematic because some might have been voting strategically: their vote in 2015 might not be their genuine first preference, and they might have been voting to defeat their least preferred candidate rather than to elect their preferred candidate. Under AV, the incentives for strategic voting are weaker, because a vote cast for a candidate who finishes lower might get redistributed to a second preference, with much the same final effect. This weakness notwithstanding, the actual vote is a reasonably solid riding-by-riding indication of the first-preference support for each political party.
Given the context and the tone of the 2015 election and its focus on Stephen Harper, it is tempting to treat the question of second preferences as having obvious answers: the second preference of NDP voters would obviously be the Liberals, and vice versa. But that temptation must be resisted. Voters choose their preferred party for a number of different reasons, which means that their second preferences might be steered in a number of different directions. Many voters may not have a second choice at all, which is consistent with the historical record of the actual use of AV. We drew on data gathered by EKOS Research, which had asked people reporting a party preference to indicate their second preferences. We acknowledge the problem that these data are only reported nationally; there are bound to be significant regional variations, as well as riding-specific circumstances, that will affect these second-preference tendencies, but these are the best data available.
For each riding that was won with less than 50 percent of the vote, we distributed the votes of lower-ranked candidates according to the EKOS report of the people who supported that party: if the Green Party candidate was the first to be dropped, and if EKOS told us that 22 percent of Green Party supporters would give their second choices to the NDP, then we added 22 percent of the Green Party vote to the NDP total, and so on for the other parties. If the NDP candidate was the next to be dropped, and if 6 percent of NDP voters had indicated the Conservatives as their second choice, then we added 6 percent of the NDP total to the Conservatives, and so on for the other parties. The procedure for Quebec ridings, where there was a fourth significantly competitive party, was slightly more complicated but similar in principle. Our simulation is therefore based on adjusted vote totals for individual ridings, working from the actual vote on October 19, not on regional aggregations and projections.
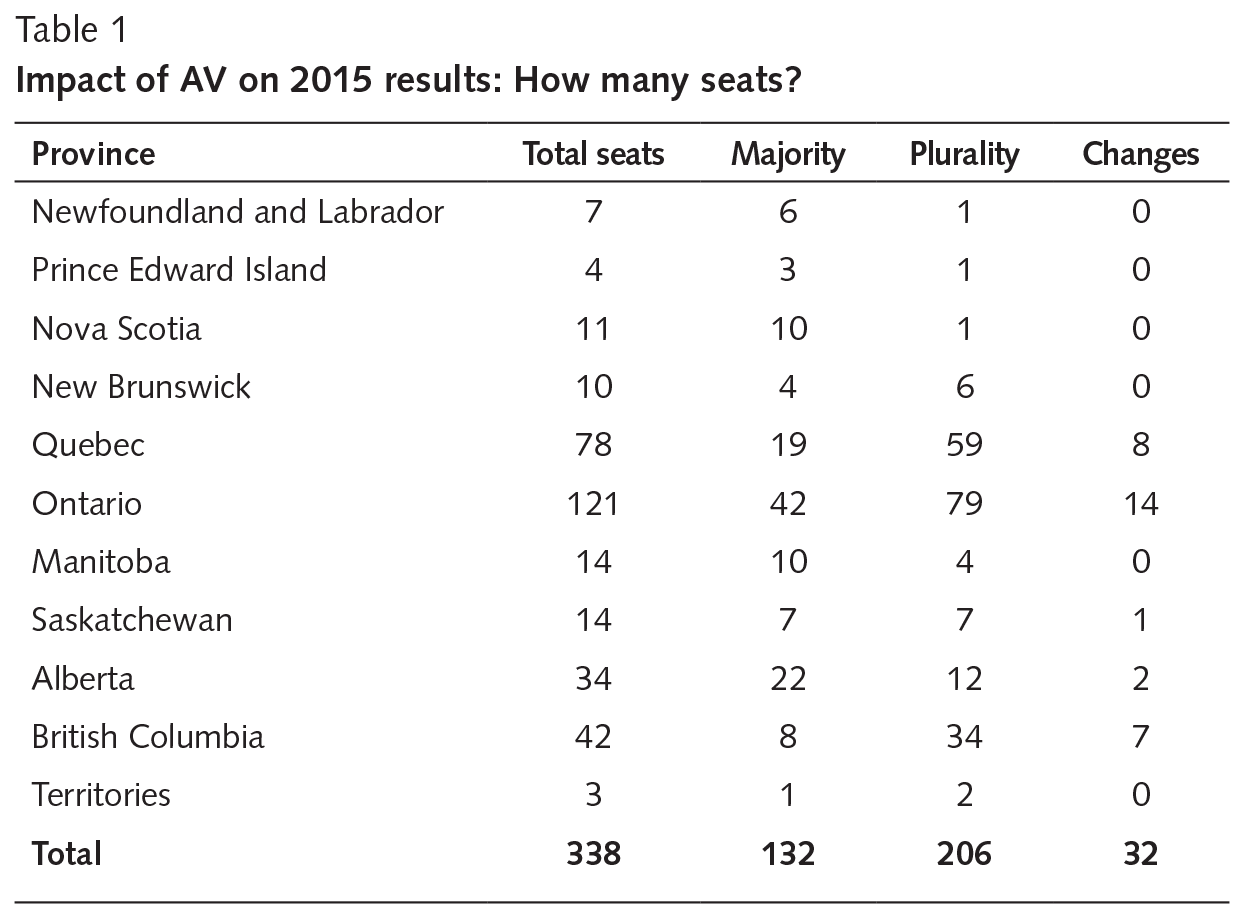
Table 1 answers the first of the obvious questions: in how many seats would a different party have won if AV had been in place? Of the 338 electoral divisions, 132 (40 percent) were won by an absolute majority of “first preference” choices, and 206 (60 percent) were won by a plurality. Of these 206, 32 would have been won by a different party under AV – that is, about 1 seat in every 6 of the plurality seats, and 1 in every 10 of the total seats.
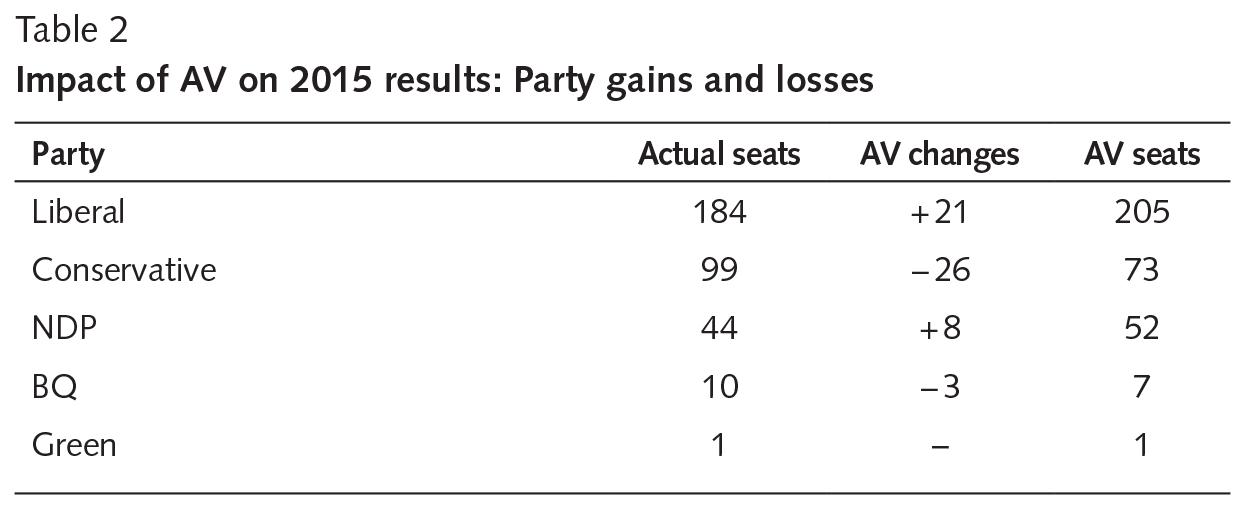
Table 2 answers the second obvious question, showing how the seat totals for the various parties would have been affected. The net result of the changed seats would have been a significant increase in Liberal seats (their majority would have increased to 205 from the actual 184) and a smaller, though still significant, 8-seat increase for the NDP. Almost all of these net seat gains would have come at the expense of the Conservatives, who would have lost a quarter of their actual seat total. The BQ would also have lost some seats. Although our simulation showed British Columbia with the highest proportion of seat changes, the impact on the Ontario results would also have been interesting. Although translating this into results in specific individual ridings is pushing our methodology rather far, it is worth noting that the flow of second preferences would likely have resulted in the defeat of several high-profile Conservative former cabinet ministers: Tony Clement, Rob Nicholson, Lisa Raitt and Pierre Poilievre.
The 2015 simulation shows that AV would have resulted in a stronger Liberal majority and a reconfigured opposition, with fewer Conservatives and more NDP MPs. Indeed, it might well have earned the “landslide” label (in our opinion, undeserved) that some journalists put on the actual election results.
We employed the same methodology to simulate the 2011 results, with one major change: for second preferences, we were able to use data from the Canadian Election Study. The larger sample size and the availability of the data set meant that we could break down second preferences at the regional level rather than relying on national-level data. Comparison with a simulation using national-level figures showed that regional variations in second preferences had only an extremely limited impact on the results (adding two seats to the “changes” total), and the overall pattern remained very much the same.

The inner workings of government
Keep track of who’s doing what to get federal policy made. In The Functionary.
The Functionary
Our newsletter about the public service.
Nominated for a Digital Publishing Award.
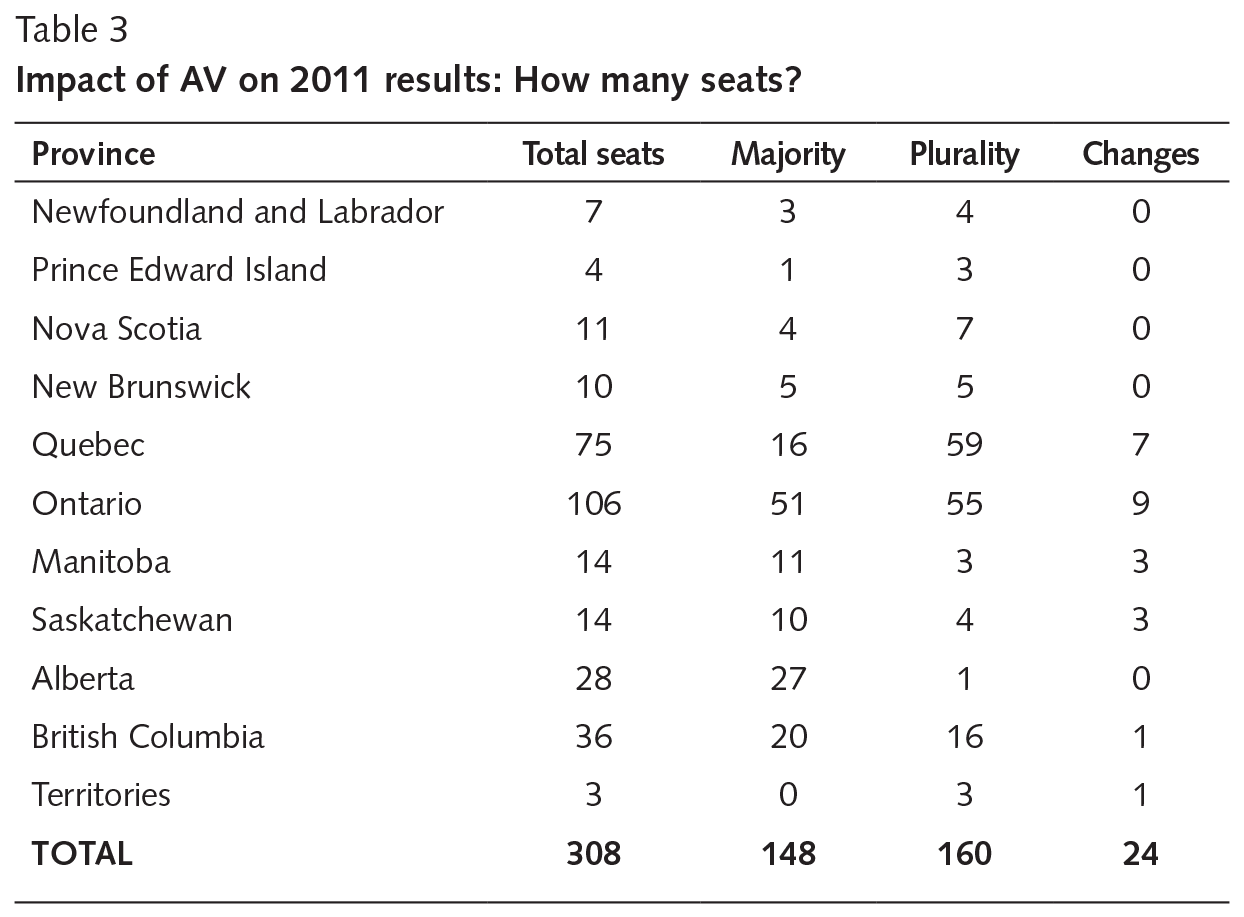
Table 3 shows how many seats would have been affected had AV been in place for 2011. A larger proportion of the seats were won by absolute majorities on first-preference choices alone, just under half (compared with 40 percent in 2015). Just over half of the seats were plurality victories, so that AV would have involved the reallocation of second-preference votes, and 24 of those seats would have changed hands; this is (as for 2015) about 1 in every 6 of the seats actually won by pluralities, and slightly lower (about 1 in every 12) for all seats.
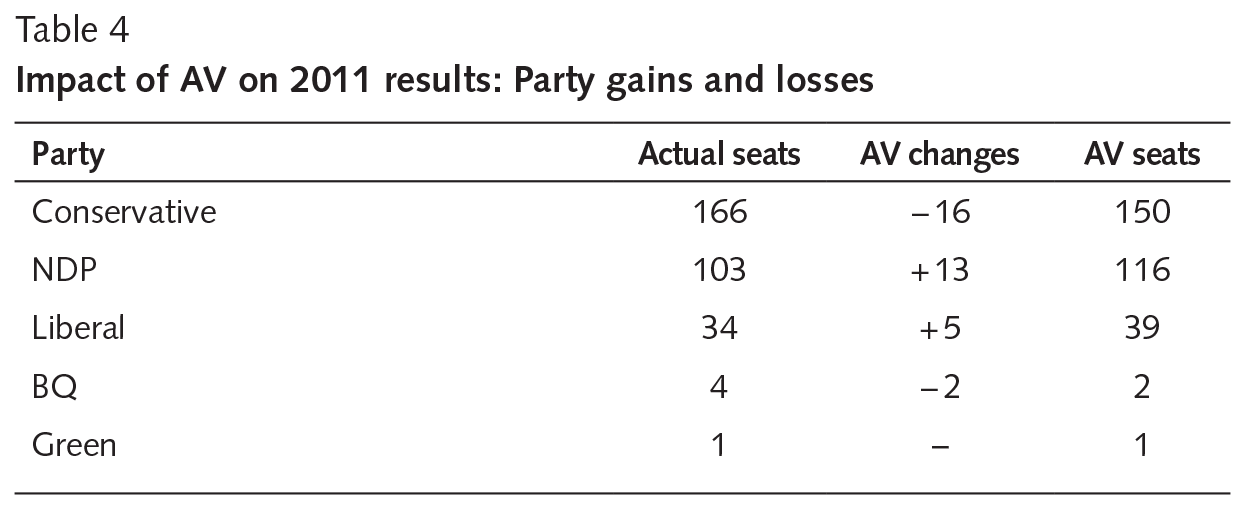
AV would have enhanced the Liberal majority in 2015; the same would not have been the case for the Conservative majority in 2011, as can be seen in table 4. Our simulation suggests that under AV the Conservatives would have been reduced to a strong minority, five seats shy of a majority. The Bloc Québécois would also have fared badly, losing half of its four seats, although this would have been less consequential for the operation of the House of Commons. Again, the most significant beneficiaries would have been the Liberals and the New Democrats, although in 2011 (unlike 2105) it would have been the New Democrats who saw the greatest benefit. The combination of NDP and Liberal seats under AV would have been enough to form (with the absolute minimum of necessary seats) a majority government, were the two parties inclined to form a coalition government: AV might well have made Jack Layton prime minister.
AV would have changed the results in more seats in 2015 than in 2011 because the impact of AV is very much dependent on context: the 2015 election saw an unusual three-way national race (and a four-way race in Quebec) with an unusual number of very close local contests. Paradoxically, however, the impact of AV in 2011 would have been more dramatic despite the smaller number of seats involved (because the weakness of the Liberals meant that fewer results would have been affected by vote transfers): it would have prevented a Harper majority and might well have resulted in a different government in power.
Alternative vote provides some political incentive to emphasize points of commonality with opponents, rather than to highlight differences as dramatically as possible.
Our simulations reveal the Conservatives to be the biggest potential losers of a shift to alternative vote. The Conservatives have a large and loyal core of partisan support, while they have struggled, with varying degrees of success, to reach out to those without partisan attachments or to be a viable alternative for those weakly committed to other parties. There is a polarization between the Conservatives and the other major political parties in Canada. The consequence in an AV election is that voters for those other parties tend to reciprocate in their second preferences (less monolithically than one might expect, but certainly enough to make a difference), and this would cost the Conservatives seats. The polarization between the sovereignist BQ and the federalist alternatives produces a similar dynamic in Quebec. So as a first generalization: polarizing parties pay a price under AV.
Of course, our simulation assumes not only that voters would have cast the same first-preference votes under AV as they did under FPTP, but also that political parties would have positioned themselves and campaigned the same way. In a competitive party system where many seats are not won by outright majorities and where many races are very close, AV makes it a wise political strategy to position your party as a palatable destination for voters’ second preferences. The Conservatives would likely not have run ads that attacked the other parties as dangerous to the economy and to the safety of Canada; such a strategy might increase the party’s first-preference support, but at a heavy cost in second preferences of the supporters of other parties. Political scientists are divided on the extent to which AV necessarily reduces political polarization over the long run, but during the actual campaign it provides some political incentive to emphasize points of commonality with opponents, rather than to highlight differences as dramatically as possible.
On the evidence of 2011 and 2015, the Liberals emerge as the most significant potential winners of a shift to AV. The party’s traditional centrist position makes it a particularly attractive second preference for parties on both the left and the right. Even in the party’s darkest hour — its dismal showing in the 2011 federal election — AV would have brightened the picture somewhat.
The NDP also does well under our simulation, although to some extent this may reflect the particular circumstances of the last decade. Some part of what seems to be a “Conservatives versus the other parties” dynamic in our simulated results may actually be a “government versus the opposition parties” effect. Under a Liberal government, the NDP may more clearly distinguish itself from the Liberal Party and emphasize its ideological distinctiveness. This might make it a less obvious destination for the second preferences of Liberal supporters (and vice versa); at the same time, and as frustrations and disappointments with the Liberal government inevitably accumulate, there may be a greater tendency for a Conservative-NDP second-preference trade-off. Nonetheless, our simulation suggests that a recommendation for AV from the parliamentary committee would require some careful thought from the NDP, which has traditionally supported some form of proportional representation for Canada.
For electoral reform advocates who favour proportional representation — that is, an electoral system under which a party’s seat share will be as close as possible to its vote share — a shift to AV would not satisfy concerns about the shortcomings of the FPTP system. Our simulation shows that AV cannot be counted on to rectify the disproportionality of electoral results under FPTP. Indeed, the 2015 results would have been more disproportional. Similarly, from this perspective, AV would not have helped much in 2011: although there would have been a better correspondence of seats and votes for the Liberals and Conservatives, that would have been offset by an even greater overrepresentation of the NDP. Nor would AV substantially alter the regional distortions that are common under FPTP. The Liberals would continue to dominate Atlantic Canada (note the zeroes in the “Changes” column of tables 1 and 3 for this region) and their dominance of Ontario would be enhanced, while the Prairies would remain undented as a Conservative stronghold. Our simulation shows that AV could be seen only as at best a half measure for supporters of proportional representation.
Whatever the arguments for and against different electoral systems, any change to the fundamental rules of the electoral game would inevitably have partisan winners and losers. Our simulation of the 2011 and 2015 federal elections under an AV system found one clear loser in the Conservative Party and clear winners in the Liberals and the NDP. However tempting it might be to factor these partisan calculations into its deliberations, the Trudeau government should proceed with caution, as the effects of AV would be more predictable in the short run than in the long. Two decades ago, AV was being suggested as a solution for the divided right to end Liberal electoral hegemony; its current appearance as a panacea for the “divided left” could well prove equally transient. Furthermore, attempts to game the system for immediate electoral gain can backfire badly. The classic example is 1950, when the BC Liberals and Conservatives attempted to use AV to keep the left-wing CCF out of power, only to find that their system had made possible the rise to power in 1952 of the BC Social Credit party (which promptly returned to FPTP). Assumptions about partisan advantages or disadvantages will undoubtedly hover in the background of the electoral reform debate, but those assumptions should be treated very cautiously indeed.
Our purpose in this article is neither to support nor to oppose the AV option, but rather to provide a realistic assessment of the scope and the impact of the changes that it would involve. That assessment involved a what-if scenario that retrofitted the 2011 and 2015 elections to an AV system, running the actual election numbers for individual ridings through that system to reach slightly different results. Whether such changes address the concerns of electoral system reformers is for them to decide.