


With an agreement reached on the Trans Pacific Partnership, the 12-member trade and investment treaty, opinions began swirling about what the deal means for the future of Canada. Plenty of facts have been bandied about in an effort to clarify the TPP’s significance: 12 Pacific Rim countries, 800 million people, 36 percent of global GDP and 25 percent of global trade, among others. But what do these facts mean? They don’t tell us a thing about what will happen once the agreement comes into force. If the speculation of Canada’s punditry is to be believed, the TPP will do the following. By reducing tariffs and opening Canada’s borders to increased foreign competition, domestic producers in tradable sectors will be compelled to innovate or lose market share. Increased innovation will lead to higher productivity and better and/or more competitively priced products, which will elevate exports, and consequently, boost GDP growth. This line of reasoning leads some to conclude that the TPP is a ‘big win’ for Canadian commercial statesmanship. Why does Canada’s intellectual class believe that the TPP is coterminous with economic progress?
Since the early nineteenth century, (many) economists have argued that liberalizing trade between countries produces mutually advantageous outcomes, even in the extreme case where one country produces all of the traded commodities more efficiently than the other. David Ricardo’s doctrine of ‘comparative advantage’ and the Heckscher-Ohlin model of international trade are the two most historically influential arguments for trade and investment liberalization (TAIL hereafter). Despite their logical coherence, both theories were abstract rationalizations generated through a process of deductive reasoning. Neither theory was anchored in empirical fact or economic history. But if we are to infer the likely consequences of the TPP we have to turn to Canada’s actual experience with TAIL.
With Canada’s entry into a North America-wide TAIL regime in the late 1980s and early 1990s, tariff schedules were reduced and trade increased, though it must be stressed that tariffs had been on the decline for a full century before the Canada-US Free Trade Agreement came into effect in 1989. Did reductions in the North American tariff schedule lead to the surge in Canadian exports in the 1990s? Figure 1 contrasts Canadian exports with the relative value of the Canadian dollar. Unsurprisingly, when the Canadian dollar devalues, domestically produced commodities become relatively cheaper and more of them are demanded by foreign customers (mainly American). And because the value of the Canadian dollar tracks commodity prices, the commodity super-cycle downturn of the 1980s and 1990s led to a devalued Canadian dollar and soaring exports. With the commodity super-cycle going into an upswing after 2000, the Canadian dollar appreciated and exports plummeted, despite Canada’s commitment to liberalized trade.
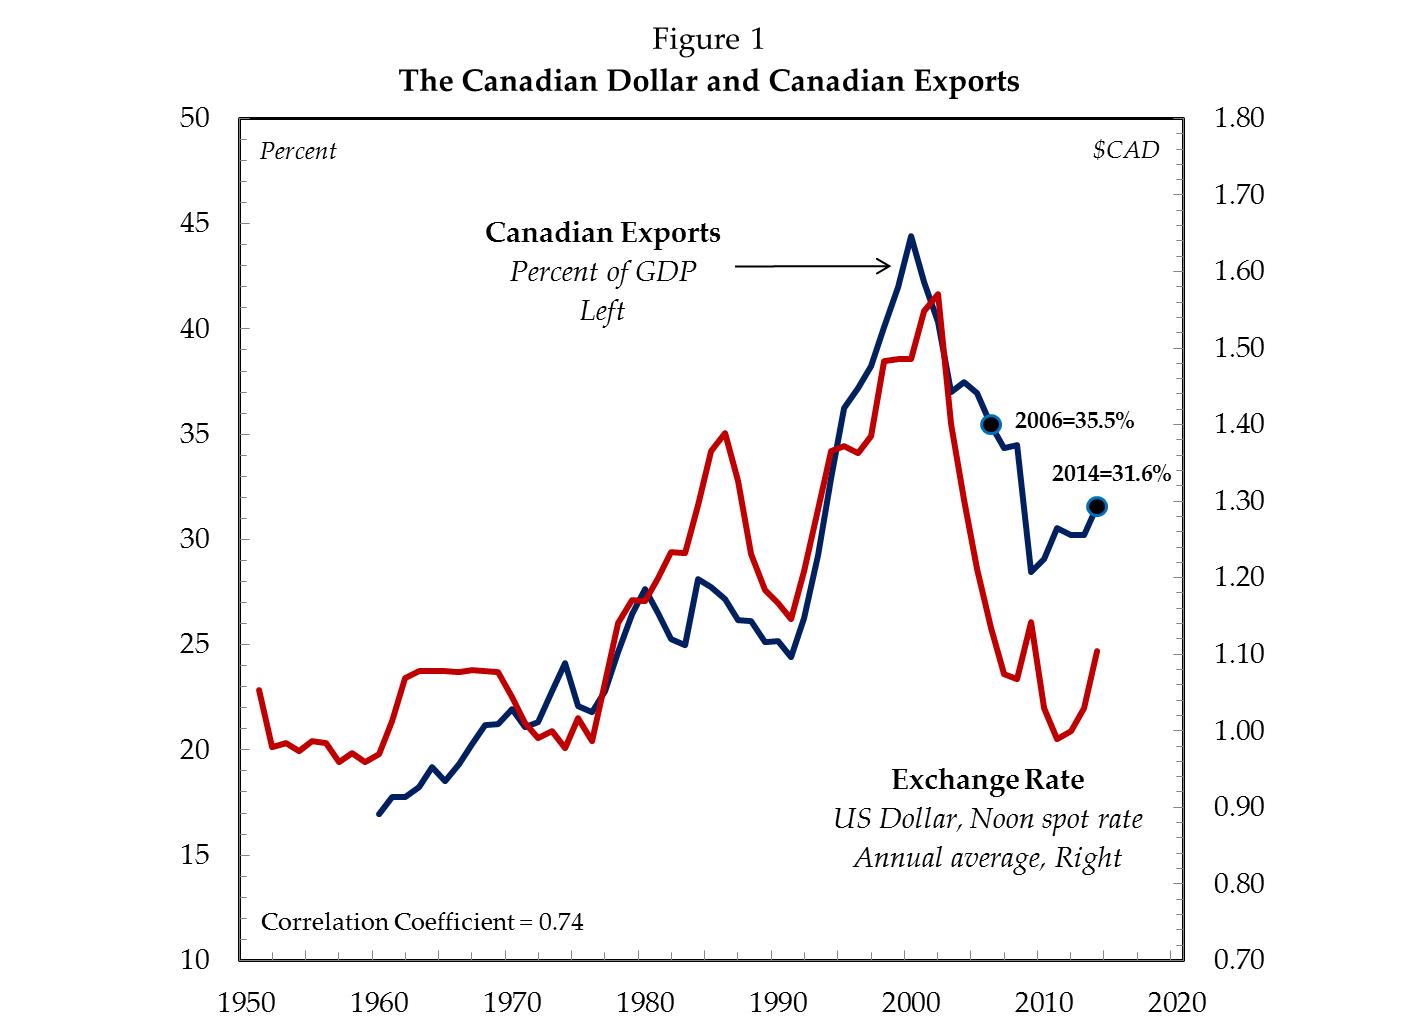
Source: export percent of GDP from World Development Indicators (code: NE.EXP.GNFS.ZS); exchange rate from Bank of Canada via Cansim Table 176-0064.
Since coming to power in 2006, the Harper Conservatives have signed TAIL agreements with dizzying speed. And while they might produce great photo-ops, they have done little to boost exports. Agreements have been signed with Peru, Columbia, Honduras, Panama, Jordan, Ukraine and Korea. In 2014 an ‘agreement in principle’ was reached on the CETA and now, in 2015, the TPP. During this time, the export share of GDP shrank from 36 percent to 32 percent and the content of Canada’s exports shifted from a more industrially diversified mixture of commodities to non-renewable resources. If history is any guide, the TPP will not signal greater exports, contrary to the expectations of Canada’s punditry.
What impact will the TPP have on Canadian prosperity? It has been (roughly) a quarter century since Canada entered into a TAIL regime with the United States. In the 25 years to 1988, the rate of growth of business investment in fixed assets averaged 4.8 percent per year, private sector employment grew at a rate of 2.4 percent and GDP per capita grew at 2.8 percent. All three growth rates were halved in the period since 1988, falling to 2.4 percent, 1.3 percent and 1.2 percent, respectively, and the average unemployment rate increased from 7.1 percent to 8.1 percent between the two periods. The claim that ‘free trade’ is a prosperity-enhancing policy rests on shaky ground (to put it politely).
So even though the conventional narrative is that tariff reduction leads to heightened international trade (‘open borders’ being synonymous with ‘globalization’) and elevated trade enhances prosperity, the evidence from Canada suggests no such thing. Canadian exports fluctuate with the exchange rate and the so-called ‘free trade era’ has not led to accelerated growth. The problem with the conventional narrative is this: it’s not entirely clear that globalization is primarily about the cross-border movement of commodities. If it was about trade, then the rapid fall in Canadian exports since 2000 would signal de-globalization (and therefore policy failure). While a part of the North American TAIL regime was undeniably geared towards tariff reduction and enlarged trade flows, the other, more significant, aspect of the agreement was a shift in the property regime to facilitate the globalization of Canadian corporate ownership. Trade is about the cross-border movement of commodities, whereas investment is about ownership. Theoretically speaking, trade has falls under the auspices of industry and production, whereas investment is more closely aligned with property and distribution. And by altering the property regime in a way that strengthens the social position of business, the TPP will reorganize power within and between TPP countries.
Before examining the globalization of Canadian business ownership, consider for a moment the changing structure of Canadian business investment in the TAIL era. Investment has two main pathways: proprietors can pay to have new industrial capacity built (via fixed asset investment) or they can buy existing industrial capacity on the market for corporate control (mergers and acquisitions). The former activity is closely associated with job creation and GDP growth. The latter activity (M&A) is wholly and only an act of redistribution—transferring legal titles between business owners—that is statistically unrelated to GDP growth. A ‘buy-to-build’ indicator captures this basic calculus open to proprietors and it is plotted for Canada in Figure 2. For each year it measures the dollar value of Canadian M&A as a percentage of business spending on fixed assets.
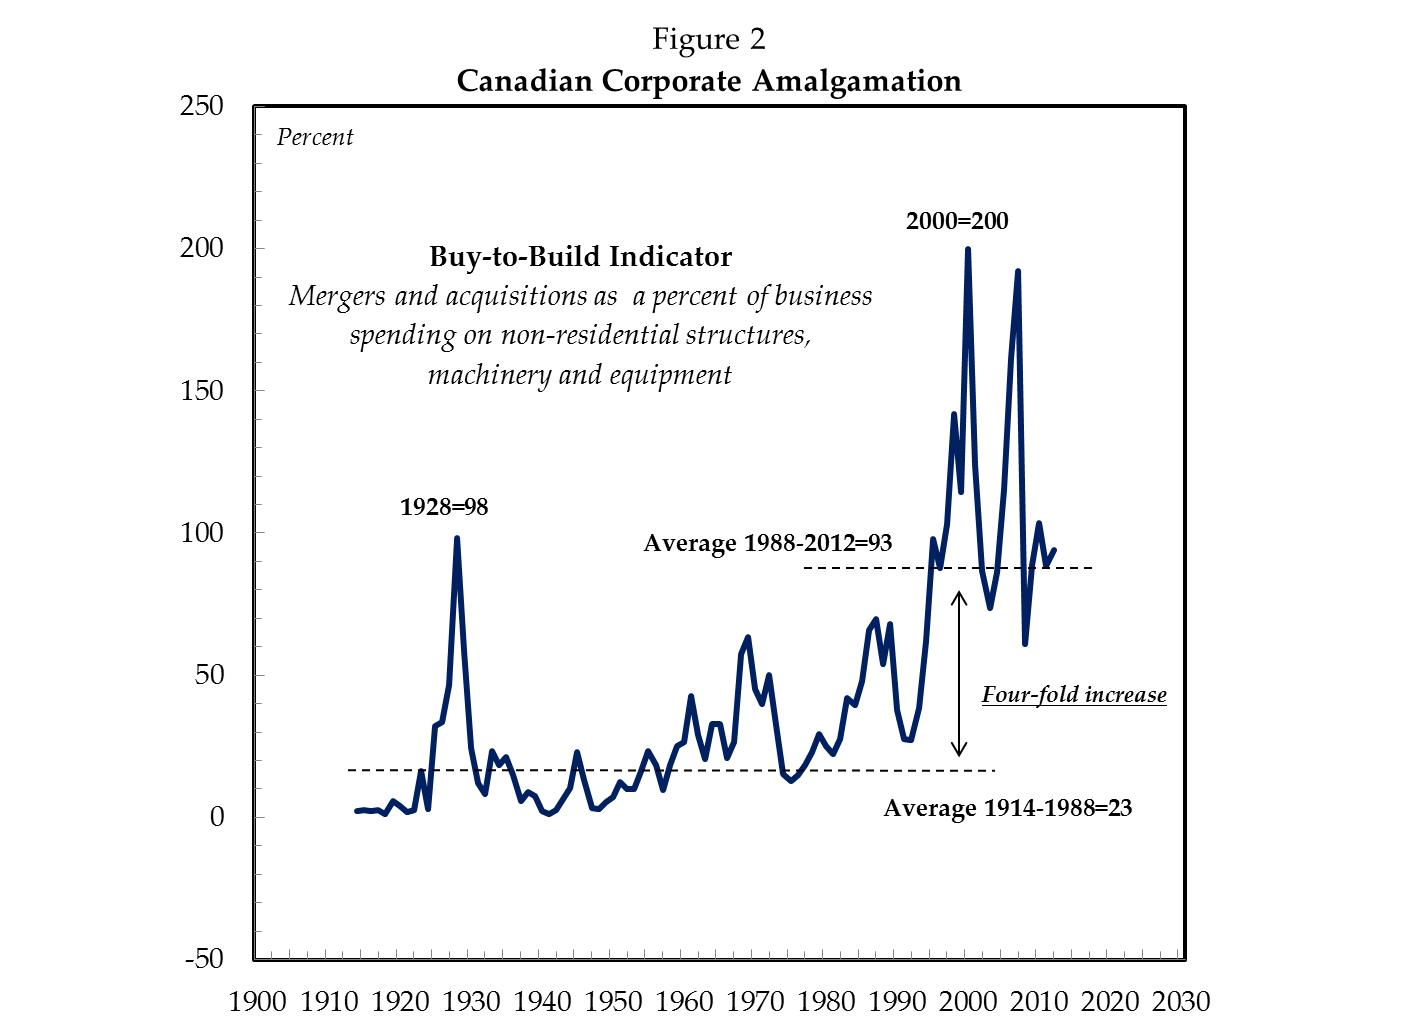
Source: See Brennan, J., 2015. Ascent of Giants: NAFTA, Corporate Power and the Growing Income Gap. Ottawa: Canadian Centre for Policy Alternatives, Figure 6, p. 33. Available online at: www.policyalternatives.ca/publications/reports/ascent-giants.
The narrative around the development of M&A from the late 19th to the early 21st centuries is one of a series of ‘waves’, each leading to different organizational forms and market structures. Figure 2 clearly depicts the wave-like pattern of M&A over the past century. It also depicts the increasing importance of M&A relative to investment in industrial capacity, especially in the TAIL era (post-1990). In the three-quarters of a century from 1914–1988, for every dollar spent on building new industrial capacity, Canadian business spent an average of 23 cents on M&A. In the quarter-century since 1988, for every dollar spent on expanding industrial capacity, an average of 93 cents was spent on M&A—a four-fold increase. Figure 2 tells us, among other things, that Canadian business investment has been radically restructured since 1990.
Figure 3 contrasts the export of Canadian commodities with the export of Canadian corporate ownership claims (both series are smoothed as three-year moving averages to ease the visual assessment). The former divides total exports by GDP and the latter is computed as the sum of dividends on portfolio investment plus dividends, reinvested earnings and profit on foreign direct investment as a percent of total pre-tax corporate profit. When this metric rises, the profit from the foreign operations of Canadian-based firms are increasing relative to the profit from domestic operations, and vice versa. This is a loose proxy for the transnationality of Canadian corporate ownership. The transnationality proxy clearly depicts the rising significance of the foreign operations of Canadian corporations. Exports and transnationality rose together from 1960 through 2000, but the relative value of exports went into reverse thereafter while the transnationalization of Canadian corporate ownership continued to increase. This is significant. It shows that globalization has not gone into reverse; it has proceeded apace, but commentators are looking at the wrong variable. The globalization of Canadian trade may be on the decline, but the globalization of Canadian corporate ownership has soared to a historic high.
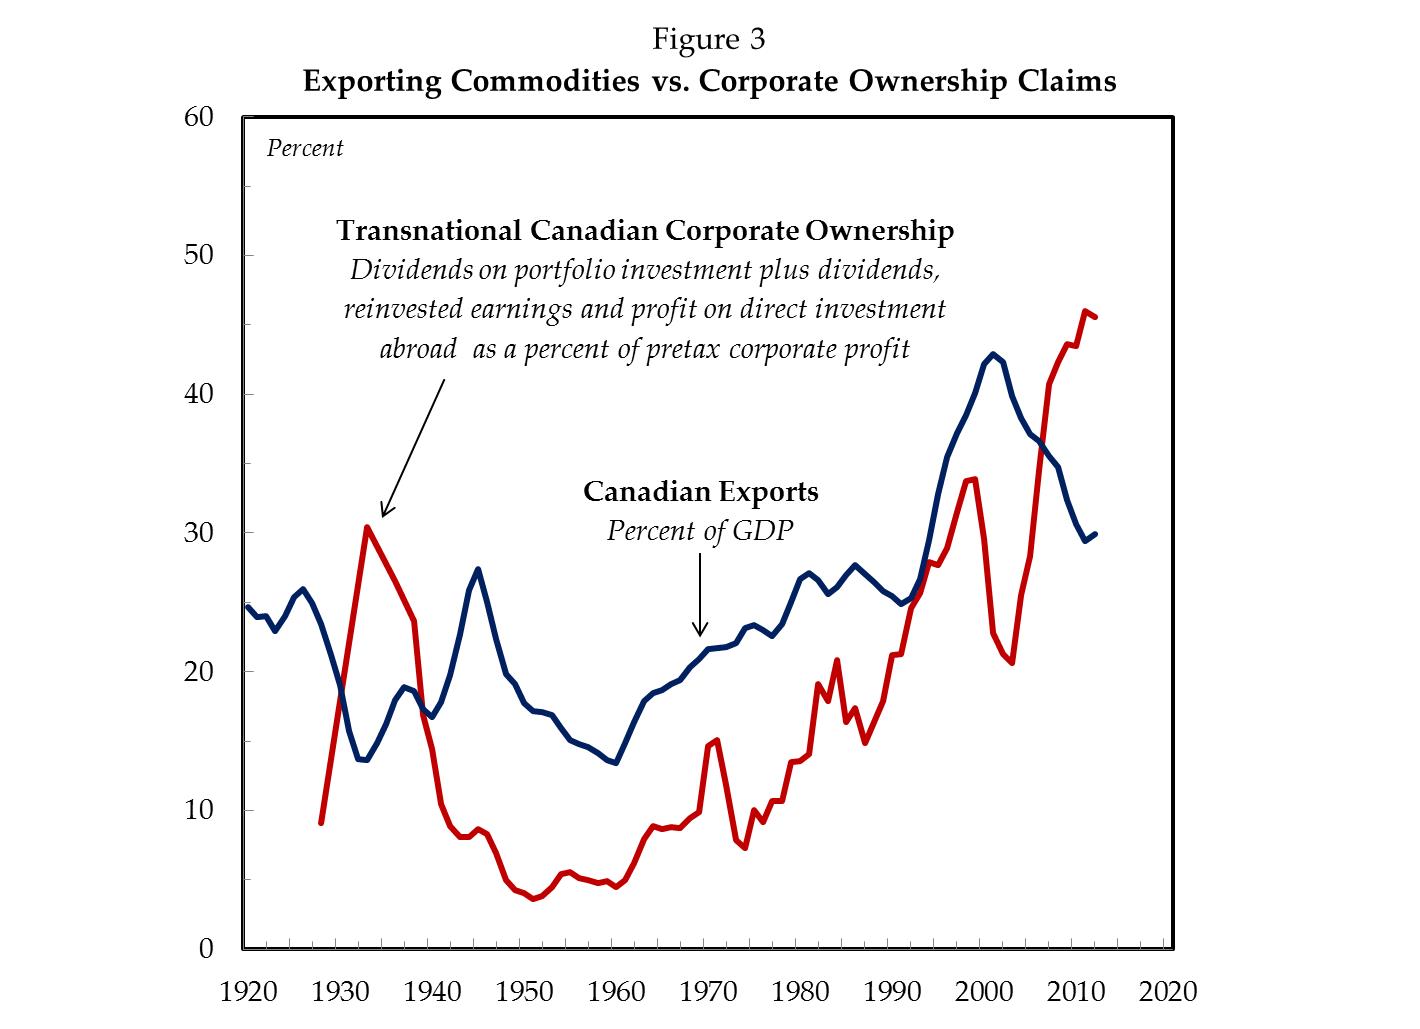
Note: data for the transnationality index are interpolated between 1928, 1933, 1936 and 1938 (continuous thereafter). Series smoothed as 3-year moving averages. Source: See Brennan, J., 2015. Ascent of Giants: NAFTA, Corporate Power and the Growing Income Gap. Ottawa: Canadian Centre for Policy Alternatives, Figure 2, p.20. Available online at: www.policyalternatives.ca/publications/reports/ascent-giants.
For Canada, ‘globalization’ has primary meant the internationalization of Canadian business ownership, not elevated trade. Canadian investment has been dramatically restructured in the TAIL era, with much less going toward the expansion of industrial capacity (fixed asset investment) and much more going toward business consolidation (M&A). Are these two processes, M&A and the globalization of corporate ownership, related? Figure 4 contrasts the buy-to-build indicator with the proxy for the transnationalization of Canadian corporate ownership (smoothed as three-year moving averages). The two series are tightly and positively correlated from the 1920s onward. The timing and duration of the amalgamation waves appears to have contributed to an increase in the foreign operations of Canadian-based firms relative to their domestic operations. The amalgamation waves of the 1990s and 2000s were primarily global and, unsurprisingly, the transnationalization of Canadian corporate ownership sharply increased over those two decades.
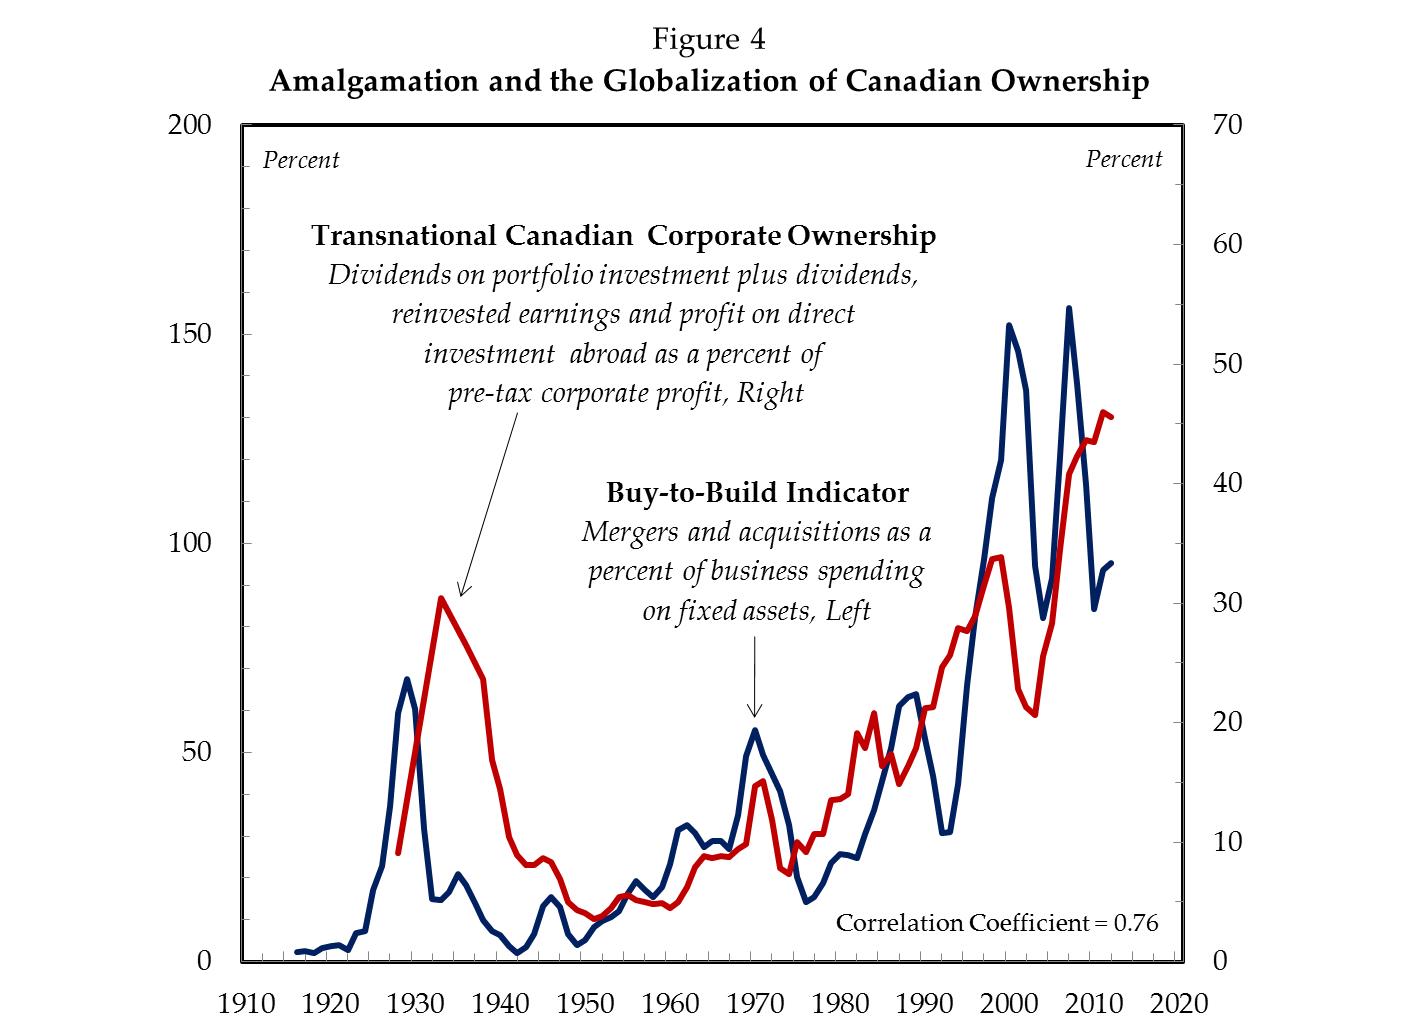
Note: data on corporate transnationality interpolated between 1928, 1933, 1936 and 1938 (continuous thereafter). Series are smoothed as three-year moving averages. Source: See Brennan, J., 2015. Ascent of Giants: NAFTA, Corporate Power and the Growing Income Gap. Ottawa: Canadian Centre for Policy Alternatives, Figure 8, p. 33. Available online at: www.policyalternatives.ca/publications/reports/ascent-giants.
Note: small and large firms alike expand industrial capacity and increase employment, but corporate amalgamation is a game initiated almost exclusively by large firms. And given that the bulk of Canadian investment abroad is held by a small number of firms (ranging in the dozens) it follows that the drive by large firms to enlarge earnings compels them to acquire firms in other jurisdictions. In their theory of globalization, Jonathan Nitzan and Shimshon Bichler argue that there is a logical progression to this acquisition process, with large firms first merging in their industries, ‘breaking the envelope’ into broader sectors and then pushing up against national boundaries through the formation of nationally-embedded firms. The final ‘envelope’ being the national political economy, if large firms are to continue to expand they require a new universe of takeover targets—hence the need for a global merger wave (i.e., globalization). The flurry of TAIL agreements in the industrially advanced world since the 1980s has facilitated and secured the expansion of Canadian corporate ownership abroad. This is the driving force behind globalization. Large firms need to grow, but because they have saturated profit opportunities within their domestic sphere they require a fresh batch of takeover targets in foreign jurisdictions. This is also why most ‘free trade’ agreements actually have so little to do with trade. Their purpose is to facilitate and secure international investment (i.e., ownership).
If the causal sequence outlined here is correct, it follows that the internationalization of Canadian corporate ownership should be closely associated with increased power amongst Canada’s largest firms. Aggregate concentration is one way to measure the overall power of big business. Twentieth-century political economists began to notice that price behaviour in concentrated markets with a few large firms differed from price behaviour in competitive markets with many small and medium-sized firms. Institutional power seemed to explain the difference. We know that large firms are more likely to lead M&A activity than small firms. We also know that Canadian direct investment abroad is almost exclusively conducted by a small number of very large firms. Does it follow that corporate amalgamation is linked with corporate concentration?
Figure 5 contrasts Canadian corporate amalgamation with the concentration of corporate assets, the latter measured as the total assets held by the top 60 firms as a percent of the Canadian corporate universe. The two series are tightly and positively intertwined over half a century, which supports the contention that amalgamation is a key driver of concentration. Asset concentration among the largest 60 firms rose from 27 percent in the early 1960s to 37 percent in the early 1980s, before falling to 30 percent in 1990. Over the next decade, and in tandem with the largest merger wave in Canadian history, asset concentration increased by one-half. As of 2010, the top 60 firms accounted for 46 percent of all corporate assets—a startling degree of concentration.
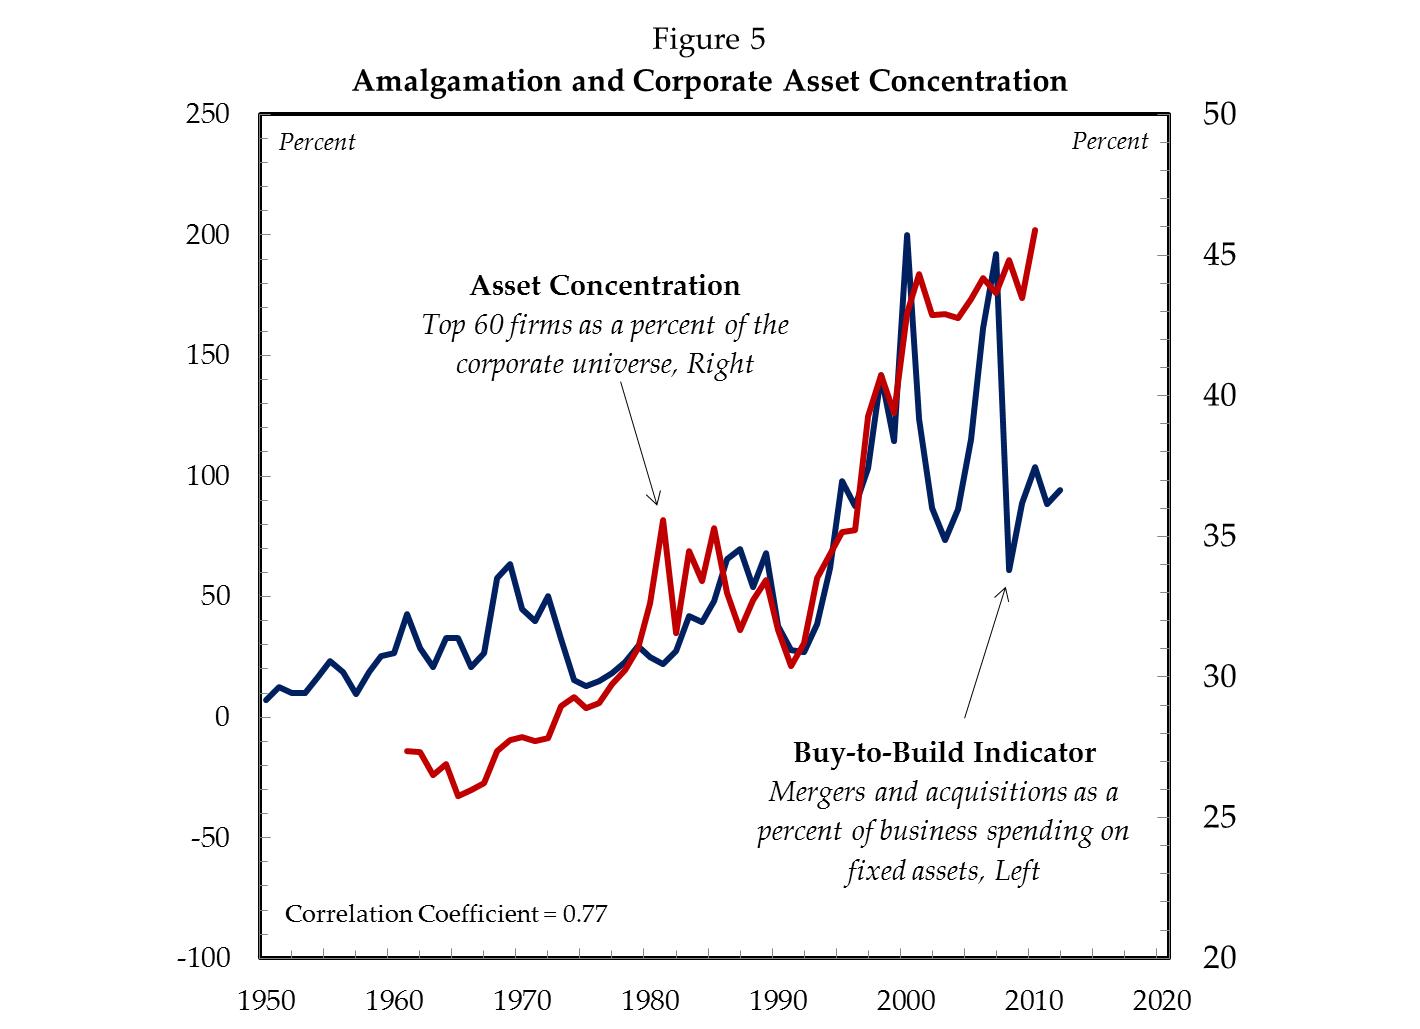
Note: total corporate assets are tabulated by subtracting the assets of government financial and non-financial business enterprises from the assets of government and business enterprises. The top 60 firms are ranked annually by market capitalization. Source: Brennan, J., 2015. Ascent of Giants: NAFTA, Corporate Power and the Growing Income Gap. Ottawa: Canadian Centre for Policy Alternatives, Figure 10, p. 41. Available online at: www.policyalternatives.ca/publications/reports/ascent-giants.
So what’s missing from the TPP debate? Recognition that, despite reducing tariff’s (which are already insignificant), the agreement is unlikely to lead to heightened exports. The heavy emphasis on investment provisions, regulatory harmonization and government policy restrictions reflect the fact that the TPP is meant to secure the expansion of dominant Canadian commercial interests in the Pacific Rim. This has little to do with ‘international competition’ or ‘free trade’. And the macroeconomic outcome for Canadians can in no way be assumed to be positive, given how weak Canadian economic performance has been since 1990. Make no mistake: the TPP will deepen Canada’s experience with ‘globalization’, just don’t count on it to have a positive effect on exports, jobs or GDP growth.
Also missing from the TPP debate is the drive for power by large firms. Corporate amalgamation not only leads to the internationalization of Canadian business ownership; it concentrates corporate assets. Increased concentration reduces competitive pressure, thickens earnings margins and enlarges the income share of large firms. With an enlarged income share, Canada’s leading firms have distributed comparatively more resources to shareholders in the form of dividends. And with the rise of stock options in the 1980s, executives were given an incentive to divert resources into share price-inflating stock repurchase. Both developments have exacerbated personal income inequality in Canada. And because investment in fixed assets is a key driver of GDP growth, the diversion of corporate resources away from industrial expansion has put downward pressure on growth. Given the deep historical facts, the likely effects of Canada’s entry into the TPP are slower growth and elevated inequality.
Jordan Brennan works as an economist for Unifor, Canada’s largest labour union in the private sector. He is also a research associate with the Canadian Centre for Policy Alternatives. A more fulsome treatment of this subject can be found in his CCPA study, Ascent of Giants. Follow him on twitter: https://twitter.com/JordanPWBrennan.