


According to public opinion data released during the recently completed Canadian federal election campaign, the Conservatives led all parties in public support from start to finish. Despite that fact, polling during the race still provided us with fascinating insights into the dynamics of the campaign. Given the growth in publicly released polling and the new technologies being deployed, it is worth reviewing how various polls performed. The coverage that polling receives and the impact that daily tracking polls can have on an election make it even more important to assess their validity.
Many research firms conducted polling during the campaign, and most were commissioned by major news outlets. Ipsos Reid served as pollster of record for Global News and the National Post. The Toronto Star commissioned Angus Reid Strategies. Nanos Research conducted daily tracking for CPAC. Leger Marketing completed research for Le Journal de Montréal and the TVA network, and Segma for La Presse. Harris Decima polled for the Canadian Press, while the Globe and Mail commissioned the Strategic Counsel.
Each firm had different approaches to arriving at party standings and related questions. Angus Reid Strategies, in addition to measuring party standings, asked respondents about the leaders’ performances both in general and also on such qualities as being honest and trustworthy. Harris Decima used a four-day rolling average of respondents to provide regular tracking of the parties’ fortunes. The Strategic Counsel was commissioned to track voter opinion in key swing ridings. It and Harris Decima specifically asked which area candidate from each of the parties respondents would vote for. Nanos Research, unlike many others, instead asked an open-ended question around vote intention without providing respondents with a list of options. In contrast, CROP, one of Quebec’s leading firms, conducted a survey asking which party, with its respective leader, voters would support: for example, options included “Gilles Duceppe’s Bloc” and “Jack Layton’s New Democratic Party.”
What marked this campaign was the emergence of new methods of collecting data — on-line and through interactive voice recognition (IVR).
What marked this campaign was the emergence of new methods of collecting data — on-line and through interactive voice recognition (IVR). And despite variations in question wording to determine vote intention, in the order in which vote intention was asked and in the treatment of the “likely voter” pool, most firms were relatively accurate on the final call. The two most accurate at calling the final national vote intention used new methods of collecting data. Angus Reid Strategies, using an on-line methodology to collect data, was most accurate and Ekos, using IVR for its daily tracking, was the second most accurate. Looking for methodological guidance from this experience provides one clear conclusion: the new methods for gathering data have proven their cases.
Most firms used telephone interviewing to complete their research during the election, notably Nanos, Harris Decima, the Strategic Counsel, Leger, Segma and CROP. Online research was conducted by Ipsos and Angus Reid Strategies. Ekos used on-line and telephone interviews as well as IVR. IVR gathers responses by telephone but using computers to interpret voice responses. This combined approach helps provide a sample that Ekos believes would be more representative than would be the case if it relied on only one technology. According to Ekos IVR also allowed it to reach more respondents.
It is impossible to precisely assess the relative merits of the data collection methods because so many other methodological issues vary such as question wording, question placement, sample size (at the regional level), how close to the actual vote firms continued to collect data and consideration, or not, of likely voters. Given that all firms were working within industry norms — although these are flexible and some answers aren’t yet clear or are still under discussion — it is safe to say that new technologies such as on-line and IVR have proven their cases.
While the new technologies performed admirably nationally, what is arguably more interesting is how polls performed at the regional level and in tracking the dynamics of the campaign. It is tempting to apply the same horse race mentality to assessing the political pollsters’ work that is applied to the politicians and their elections — who won and who lost.
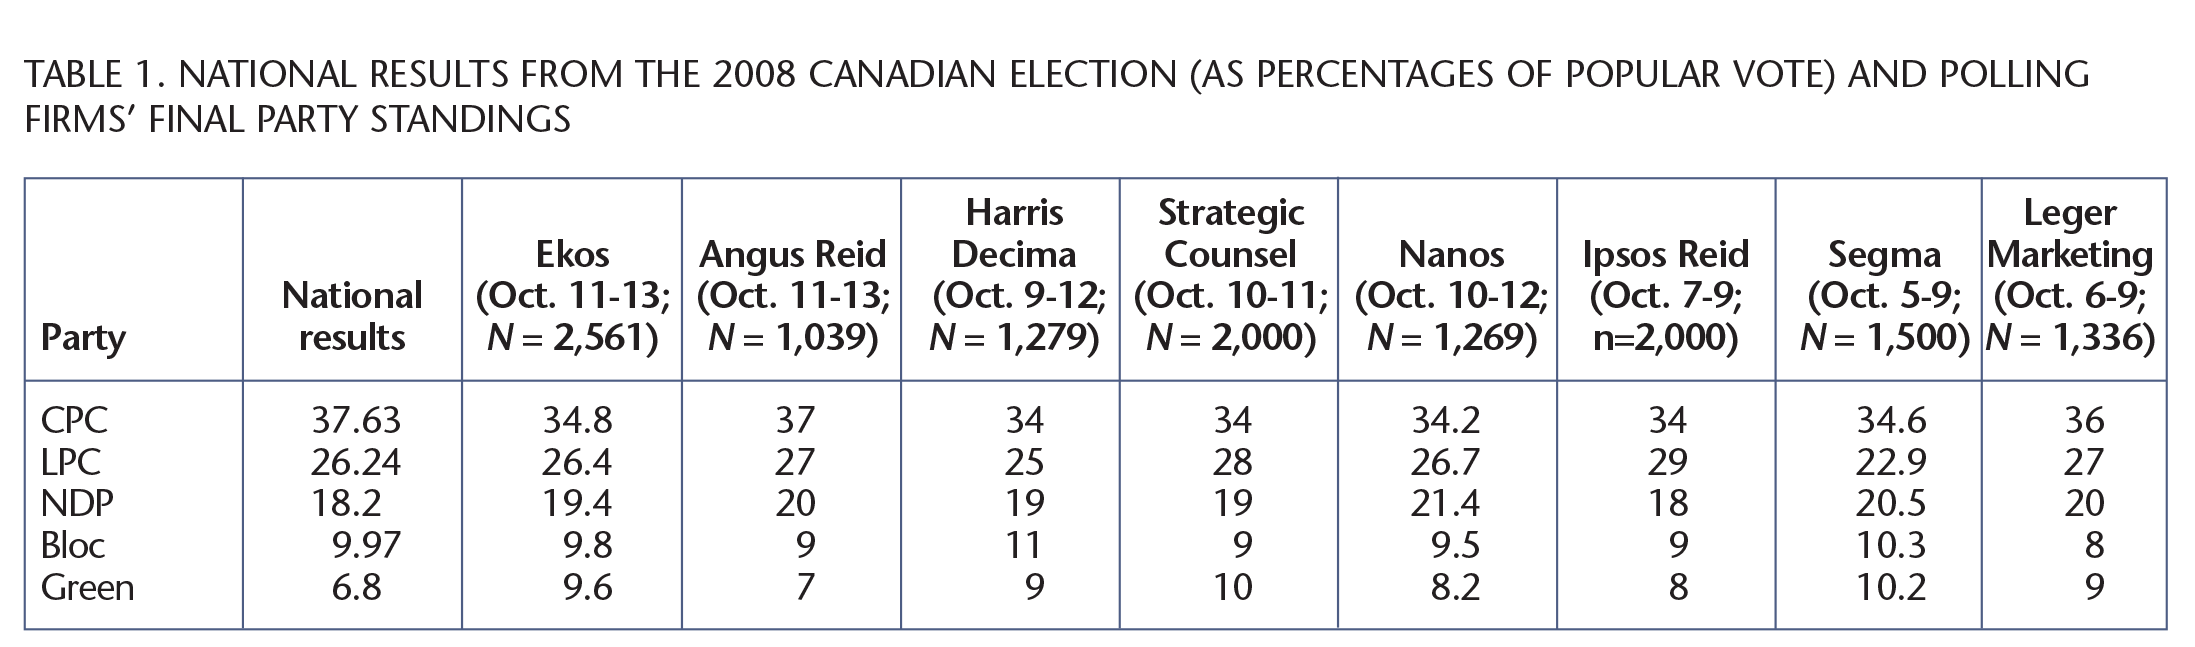
The truth is that in terms of measuring vote intention on a national basis, virtually all of the public polls were accurate — certainly to within their margin of error. Angus Reid Strategies’ final poll most closely resembled the final election results (see Table 1 for national results), but all pollsters had the order of the parties correct (this has not always been the case) and correctly pointed toward a Conservative minority.
Most polling organizations had the combined NDP/Green vote several points higher than it turned out to be on election day.
Aside from Angus Reid Strategies, most other organizations indicated weaker Conservative support than turned out to be the case. This tended to be as a result of overstating the vote on the left of the spectrum. Most polling organizations had the combined NDP/Green vote several points higher than it turned out to be on election day. This may have been a factor of voter turnout rather than incorrect polling. Support for the NDP and Greens is higher among younger Canadians, who are less likely than the norm to vote, while support for the Conservatives is higher among Canadian seniors, who are more likely than the norm to actually cast a ballot.
This is an area where trends in US polling and politics are instructive. Because only about half of eligible Americans actually cast ballots in US presidential elections, polling organizations all have models for determining likely voters. The results among the likely voter cohort may differ substantially from the results among the entire population. For example, with a week to go in the Obama/McCain race, Gallup is showing a nine-point lead for Obama among registered voters (themselves likely only about 70 percent of eligible voters) but only a three-point lead for Obama if Gallup applies its traditional likely voter modelling. This is because the bulk of Obama’s advantage comes from younger voters. Because of Obama’s success in turning out those voters in the Democratic nomination process, Gallup has created a second, expanded, likely voter model that allows for the possibility of higher turnout among young people. In the last week of the presidential campaign, this model projected an Obama lead of seven points.
Canadian political parties have been doing likely voter screening in their private polling for some time, for exactly this reason. With Canadian turnouts now around only 60 percent of eligible voters, it is no longer sufficiently accurate to know what the population thinks. Polling must now go further to determine, additionally, who are likely voters. Some organizations took tentative steps in this direction publicly this election, but the lack of voter turnout modelling may have contributed to understating of Conservative support at the end of the campaign. This is not without impact. The amount of polling available led to more ongoing discussion of strategic voting than has been the case in the past. Ekos says it measured almost one in four voters saying that the polling data were a factor in their choice. Overstating NDP and Green support while understating Conservative support may have misled voters who wanted to cast their ballot strategically.


The inner workings of government
Keep track of who’s doing what to get federal policy made. In The Functionary.
The Functionary
Our newsletter about the public service.
Nominated for a Digital Publishing Award.
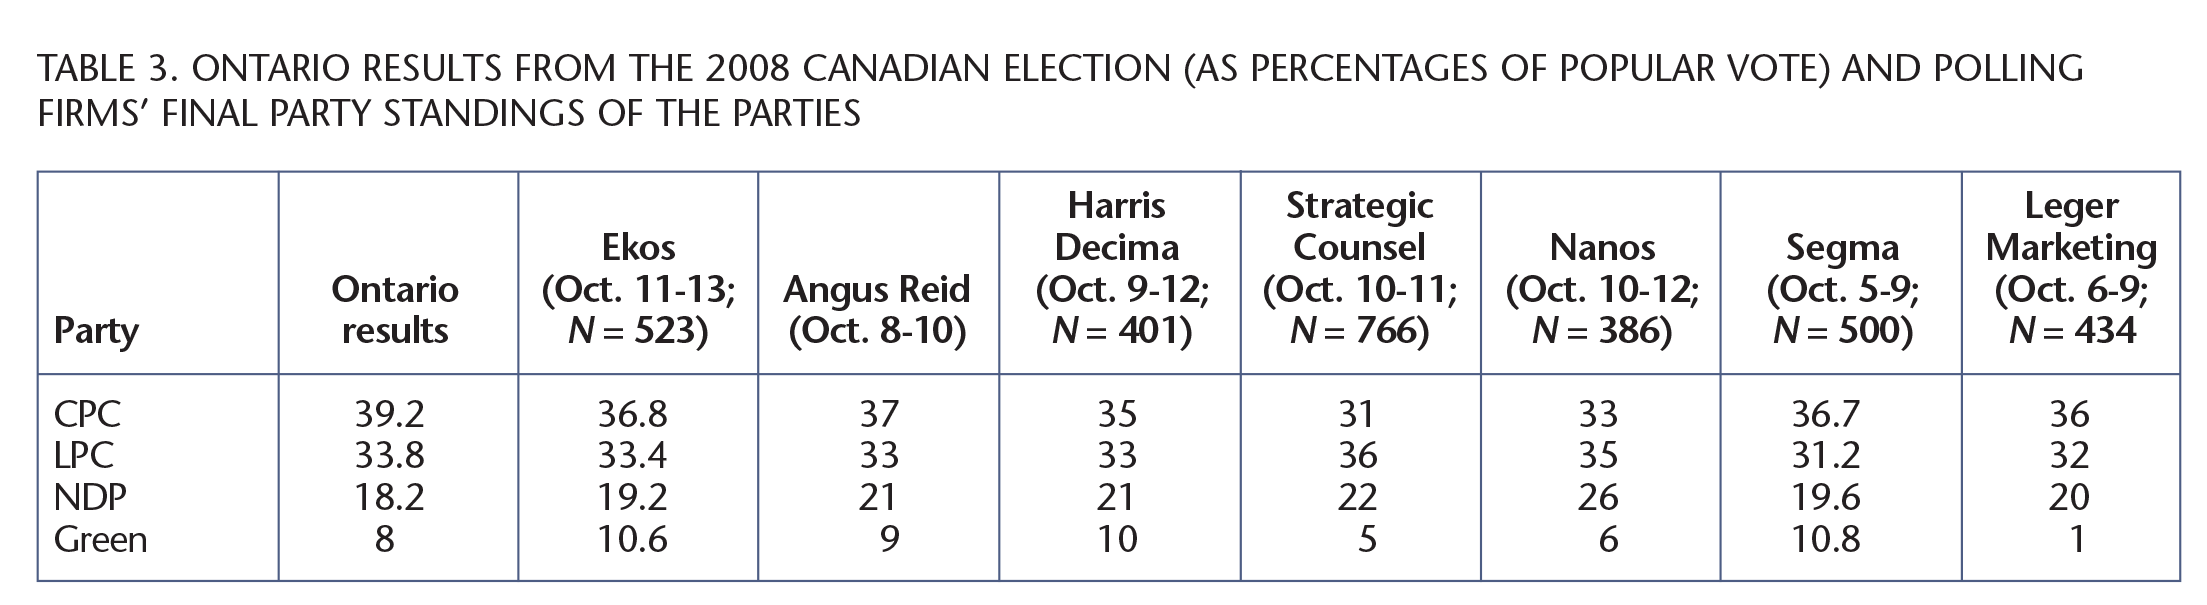
For all their accuracy at the national level, the tracking polls tended to be quite spectacularly incorrect on their regional breakdowns (see tables 2 and 3). If one is going to predict seat counts based on polling, then one needs accurate readings on each province and — ideally — subregions within each province. Lumping different political cultures together (such as Manitoba and Saskatchewan or, in this election, Newfoundland and New Brunswick) to get a larger cell size obscures more than it reveals. Similarly, an overall Quebec number, no matter how accurate, is likely to be less than helpful in seat projections because of the difference in voting behaviour on and off the island of Montreal. Real seat projections require a tremendously large national sample size. Even within the modest ambitions of the public pollsters — who are often doing this work at a financial loss because of low media compensation — the regional or provincial numbers were not helpful in this election. Small sample sizes led to large fluctuations in support that may or may not have actually occurred. And in the final analysis, the public results on a regional basis were significantly different. Using Ontario as an example, all organizations understated the Conservative percentage of the vote and the Conservative margin over the Liberals while overstating support in Ontario for the NDP. Two organizations even had the Liberals winning Ontario when they actually lost by five and a half points. That difference alone would have made for a substantially altered result on election night. Regional numbers for BC and the Atlantic were even less reliable and less stable.
In part this is because tracking surveys — a relatively new feature of the Canadian political landscape publicly — are not intended to derive an exactly accurate result. Neither the sample size nor the sample construction lends itself to that. Daily tracking polls were developed for the internal use of campaigns to see developing trends early, to understand the dynamic of the campaign, and to test new messaging on an ongoing basis. The sudden proliferation of public daily tracking polls — last election there was one, this election there were three daily tracking polls and one that was regular but not daily — can likely be traced to two phenomena.
The main reason public pollsters do this work is that the media will report it and thereby provide those organizations with name recognition and status.
One is the insatiable appetite of the media for polling information. The main reason public pollsters do this work is that the media will report it and thereby provide those organizations with name recognition and status. Polling drove media coverage in a substantial way during this campaign, even by historical standards. Understanding who is winning and who is losing has always been a major feature of election coverage. The daily tracking polls have added a new dimension in which the media has new material on the horse race every day, and also is able to assess each party’s actions in the context of the fluctuations in polls on a daily basis.
The other driver of tracking was that many public pollsters were very badly off when predicting the results of the 2004 federal election. It was hypothesized that a late movement to the Liberals was not captured in polling because it happened after firms had conducted their final polls of the campaign. In this election, the daily trackers were calling right through the final weekend.
Having access to daily tracking research does explain some dynamics of the election that are useful to know.
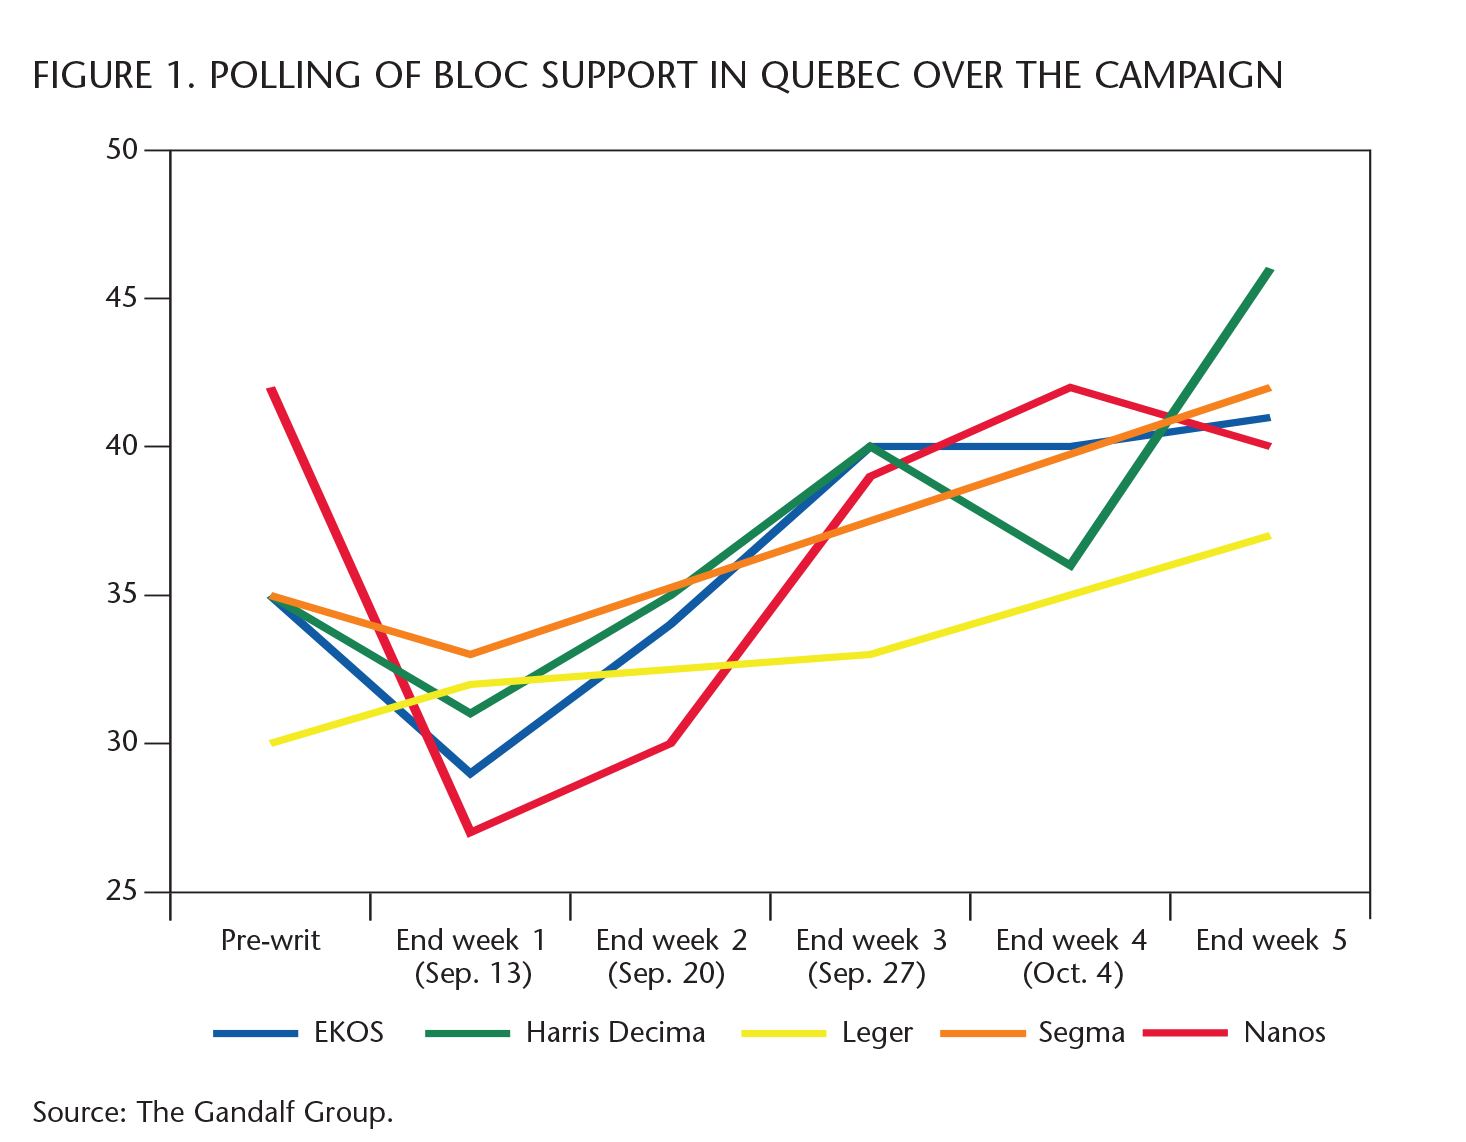
First, it tells us that there was much more volatility than periodic polling might have suggested. Because of daily tracking, we are able to see how different the result could have been in the hard-fought battleground of Quebec. The first week showed the BQ continuing a pre-writ slide and the Conservatives with momentum in Quebec. The Conservatives then went into a precipitous decline in support that really became the story of the election as it put Conservative hopes for a majority government further out of reach. Finally, the daily tracking from most organizations showed the BQ surge levelling off by the end of the third week and perhaps declining slightly as election day approached.
The tracking results also seemingly contradict one of the central points of conventional wisdom about the campaign in Quebec. Most observers ascribed the decline in Conservative fortunes in Quebec to a combination of outrage over remarks made about culture funding by Prime Minister Harper and the announcement of tough measures to deal with young offenders, both of which were seen as being anathema to Quebec voters. The tracking tells a different story. The Prime Minister made the youth crime announcement on September 22 and made his comments about culture on September 23. However, the daily tracking results show that the Conservative decline in support in Quebec began much earlier than that — around September 13 or 14 (see figures 1 and 2). That doesn’t mean that the cuts to cultural funding didn’t play a role in Conservative loss of support. The issue had been a major point of discussion prior to the Prime Minister’s remarks about galas, fuelled in part by an on-line video parody that circulated virally. But it does indicate that the slide in support predated the PM’s intervention on the issue and on youth crime initiatives. There had to be other factors at play. One of them was likely advertising. The advertising in Quebec was more sharply negative about the Conservatives throughout the campaign than was opposition advertising in English Canada. A negative barrage on television in the first week by the BQ, Liberals and NDP had likely started to take its toll by the time the exacerbating factors came along.

The tracking also indicates another fascinating development in Quebec that is indicative of the partisan rootlessness of that population right now and the volatility that results. A strong performance by Dion in the French leaders’ debate had the effect of almost doubling Liberal support in Quebec immediately following. Some of the Liberal growth came from the BQ, but more of it came from the Conservatives. Dion was unable to hold onto his postdebate increase in support and Liberal numbers gravitated down to previous levels. As voters drifted back away from the Liberals, however, they did not return to the Conservatives. Instead, most of them went to the BQ. In other words, a significant number of Quebec voters went from the Conservatives to the Liberals and then to the BQ in the space of two weeks.
The public polling in this election was fascinating to watch. New methodologies proved their utility. There was more information publicly available than ever before and on a more timely basis, spawning strategic voting Web sites and vote swapping across the country.
On the other hand, voters were not well served by the lack of accuracy in the regional numbers as election day approached. Nor was the polling used to stretch beyond the horse race to help the media and Canadians understand what was driving voting behaviour and how issues and personalities were playing into it. Finally, of course, it is arguable whether Canadians are well served by the media preoccupation with polling results. It is useful information to which Canadians should have access, but the extent to which it crowds out more substantive coverage of issues — what politicians say they will do, as opposed to the “why are they doing it” — leaves Canadians with little information other than who is winning, or who might.