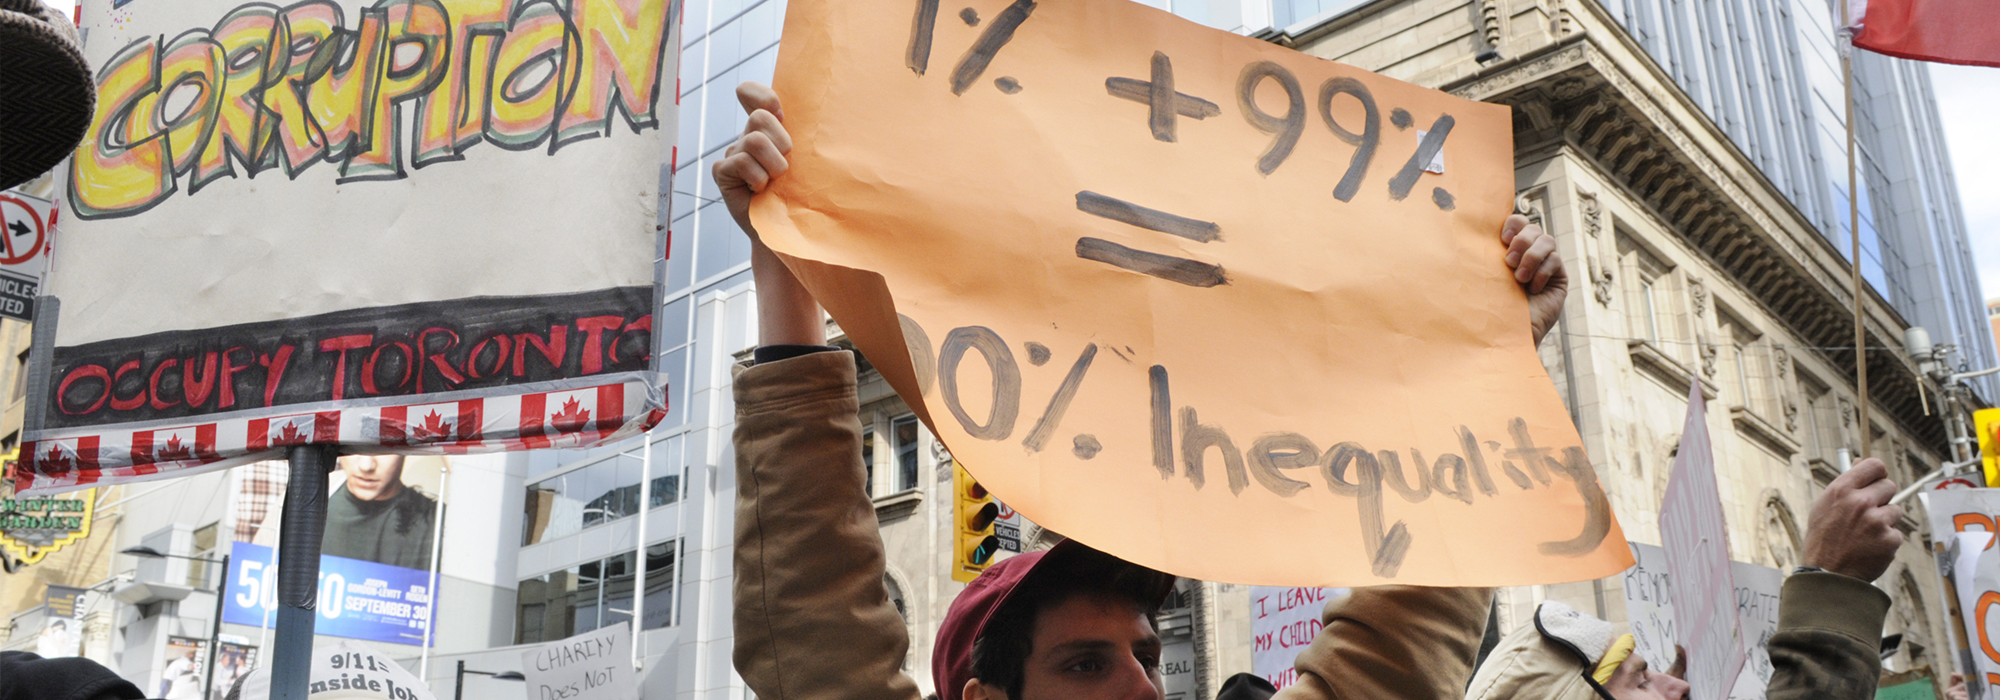


In October 2011, the worldwide Occupy movement spread to Toronto, with protesters bearing placards that read “Arrest the 1%.” Groups camped out in the late autumn weather from St. John’s to Vancouver in protests that drew attention to how people in the top 1 percent of the income distribution continued to make gains at the perceived expense of everyone else. At the time, it was widely thought that the Occupy protest was ineffective, in part because there was no collective, coherent and feasible set of demands. But in retrospect, it’s clear protesters had identified an unusual rise at the top end of the income distribution and, coincidence or not, it appears that the top-end surge has not resumed since then – at least, not in Canada.
The protesters were not imagining gains by the top end. From 1982 to 2011 (and for that matter, from 2011 to 2017), there was essentially no change in Canadian income distribution outside of the top 1 percent. That is, the lowest 10 percent of income recipients continued to receive a tiny share, but it was a constant tiny share. As another example, those in the second-highest 10 percent continued to receive a remarkably stable 17 percent share of all income, year in and year out. There was similar constancy across the income distribution – except at the very top. That changed.
Emmanuel Saez and I developed personal income tax data-based estimates of the share of market income (meaning all income except government transfer payments and capital gains) received by Canada’s top 1 percent from 1920 to 2000. From that, we saw that the share of total income going to the top 1 percent was as high as 18 percent in the 1920s and 1930s before dropping to about 10 percent during the Second World War. There was a further decline to about 8 percent around 1980. (Figure 1 blends our data series with Statistics Canada data to extend the series to 2017).
During the first period of focus – from about 1980 to 2007 – there is a surge in the share of total income for the top 1 percent, reversed to some degree with the Great Recession that began in 2008.
It is perhaps no surprise that the Occupy movement came during that painful recession, and the Canadian protesters were certainly not wrong when stating that the top 1 percent had gained relative to others over the last 30 years. Looking at income levels rather than income shares, in 2019 inflation-adjusted dollars, from 1982 to 2007 average total income for individual tax filers rose about 18 percent – from roughly $40,000 to roughly $50,000. However, income for the average individual tax filer in the top 1 percent rose by a much greater amount, more than doubling from about $285,000 to about $580,000. And the average income of those in the top 0.01 percent – that is, the top 1 in 10,000 – more than tripled, from about $2.3 million to about $7.8 million. While these figures are before tax, by individual, and annual, the trends are similar using values that are after-tax, on a family basis, and based on following individuals over a number of years to minimize unusual, single-year events.
Turning to the period 2007 to 2017, which contains the Great Recession and its aftermath, and continuing to adjust for inflation, overall average income rose about 5 percent while the average incomes of those in the top 1 percent and top 0.01 percent declined by 14 percent and 25 percent, respectively. This did not offset the surge up to 2007 but suggests that surge has stopped.
There are bumps throughout the data, such as an upward blip in 2015. That was almost entirely because of an increase in private corporation dividends, as high-income taxpayers moved some income forward before the newly elected Trudeau Liberals raised their taxes in 2016. So some of the reduction in top income shares in 2016 and 2017 might be only temporary.

The inner workings of government
Keep track of who’s doing what to get federal policy made. In The Functionary.
The Functionary
Our newsletter about the public service.
Nominated for a Digital Publishing Award.
What caused the pre-2007 income surge? I discuss the various theories here, but there is still no consensus as to what part was played by changes in technology, international trade, politics or corporation and organizational governance. The US seems to have been the epicentre of the income surge, but some economies such as Canada, the UK, Australia, Ireland and New Zealand followed the trend much more closely than others (including most continental Europe countries and Japan) suggesting the explanation cannot be technology alone. There were also differences across Canadian provinces, with the bigger provinces following the overall Canadian pattern while others didn’t – most remarkably in Newfoundland and Labrador, which showed no widening in the income gap at all from 1982 to 2017. That was because of strong resource-based growth in average income in the most recent 10 years.
A related kind of inequality is wealth inequality, which is increasing at a modest rate in Canada, according to my reading of the evidence. Kevin Milligan and Tammy Schirle have shown that the affluent also benefit from longer lives, although that longevity inequality has not been increasing. Miles Corak has shown that inequality of opportunity is lower in Canada than in the United States (implying, for example, that Canadian children of the less affluent have a better chance of moving up the income distribution.) While I don’t believe there is convincing evidence of trend so far, I am concerned that this Canadian advantage might not survive austerity in public education and health care.
Is income inequality increasing in Canada? Noting that almost all of the change has been among the top 1 percent, the answer is yes – if we measure from the 1980s; but no, if we measure from the Great Recession of 2008. Did the Occupy movement of 2011 have something to do with the surge not resuming after the recession, or was it happenstance? In any case, what hasn’t stopped is public discussion of inequality, even without Occupy protest camps.
I thank Keith Banting and other organizers for the invitation to make the presentation from which this article is drawn at the Queen’s Institute International Conference on Social Policy, August 2019. I also thank Zvez Todorov, Sara Kamala Anaraki and Anthony Hong for research assistance, the Social Sciences and Humanities Research Council for Canada for research support and Brian Murphy for sharing with me some important insights on the data.
This article is part of the Ensuring inclusive prosperity when all boats aren’t being lifted special feature.
Do you have something to say about the article you just read? Be part of the Policy Options discussion, and send in your own submission. Here is a link on how to do it. | Souhaitez-vous réagir à cet article ? Joignez-vous aux débats d’Options politiques et soumettez-nous votre texte en suivant ces directives.