


Much has changed in 11 months.
Cast your mind back to Joe Oliver’s 2015 budget, when commentators remarked that the Conservatives had managed a crafty one-two punch: first, to eliminate the deficit, and then to leave the cupboards bare for the other parties going into the election.

The inner workings of government
Keep track of who’s doing what to get federal policy made. In The Functionary.
The Functionary
Our newsletter about the public service.
Nominated for a Digital Publishing Award.
Budget 2016 marks a turning point in Ottawa’s fiscal policy. The governing party, the policy approach and the policy priorities are different. The Conservatives thought that a smaller government, lower taxes, balanced budgets and foreign trade deals were the best ways to grow our economy.
For the Liberals, the economy remains a central preoccupation, but they’re offering a more activist approach to government in the hopes of fostering more inclusive growth. And though they still feel compelled to say that they’ll eventually balance the books, that can wait until the end of their mandate, if at all.
And so the fiscal outlook in this budget is different than in the last one.
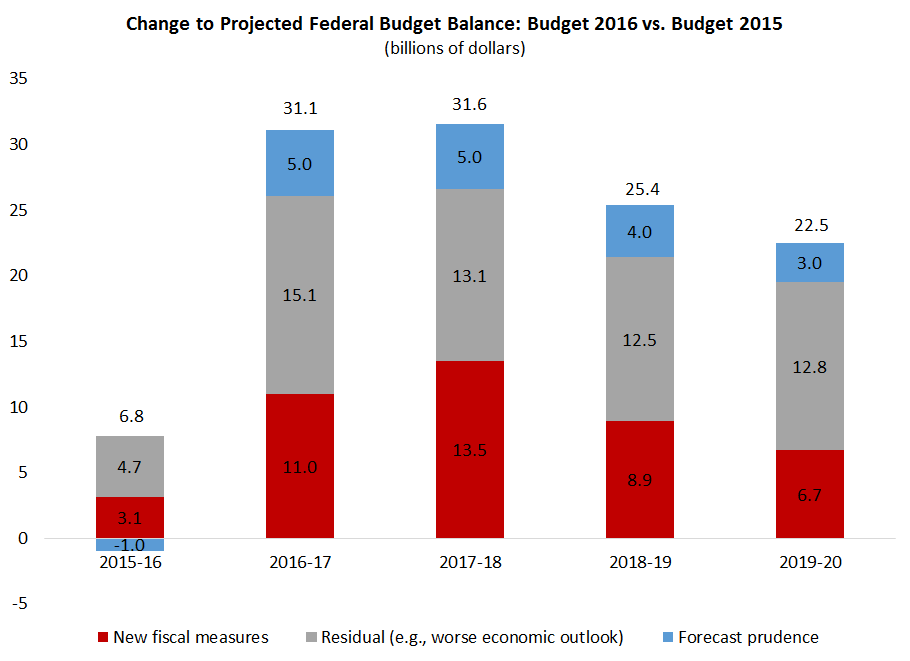
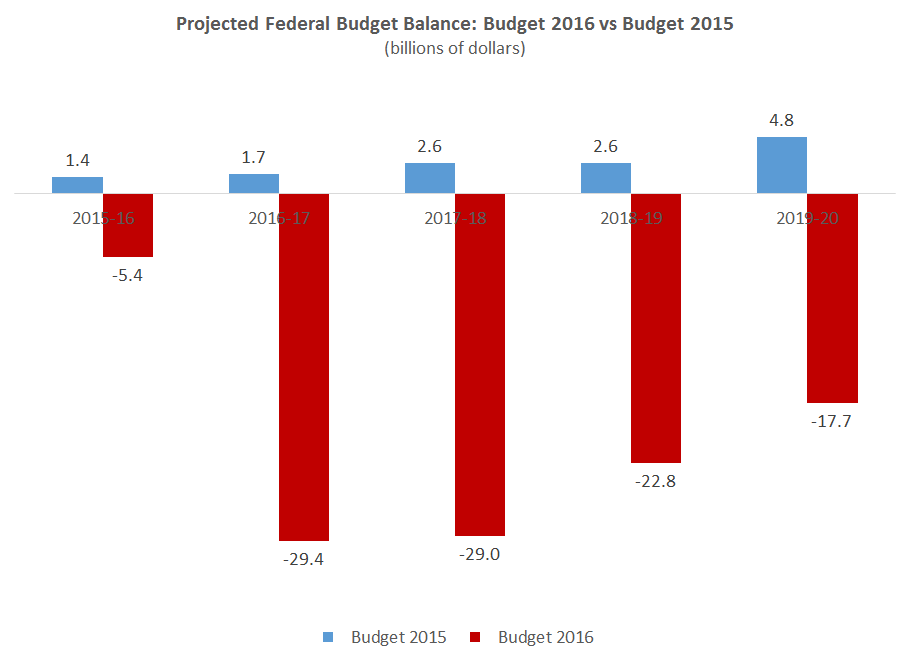 With all of the talk about these “big deficits” and “massing spending”, it’s instructive to wade into the numbers to see how three factors are changing the government’s bottom line — the weaker economic outlook, new fiscal measures and more forecasting prudence:
Last year, my post-Budget 2015 blog noted that if the government simply tried to keep its debt-to-GDP ratio steady — at around 30% rather than pushing it down to 25% as the Conservatives had planned — that they would have about $130 billion in additional “fiscal room” over the next five years.
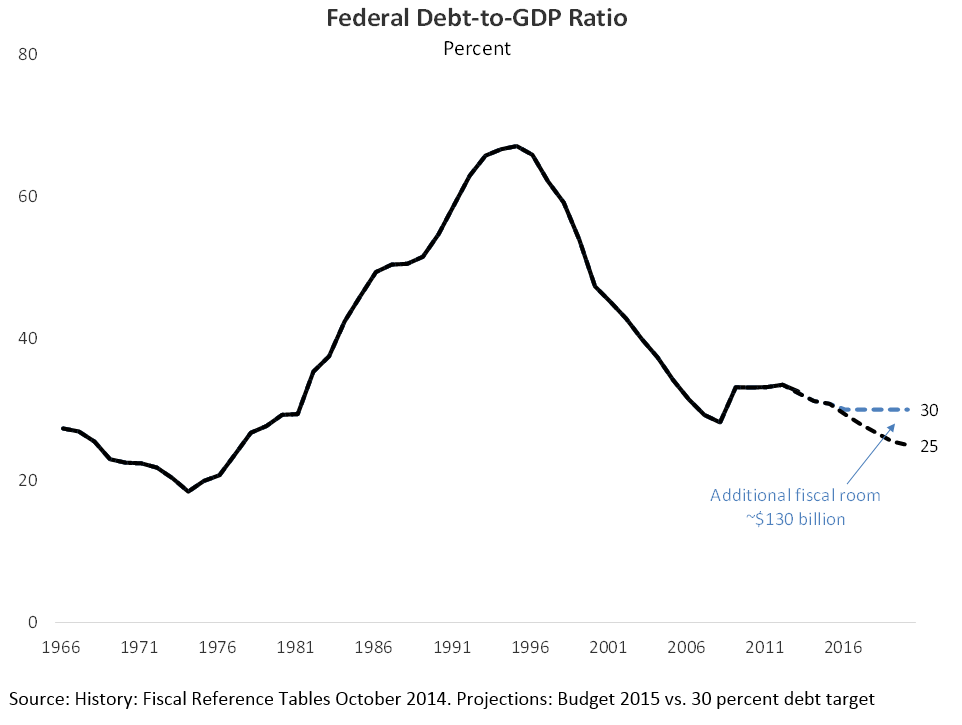
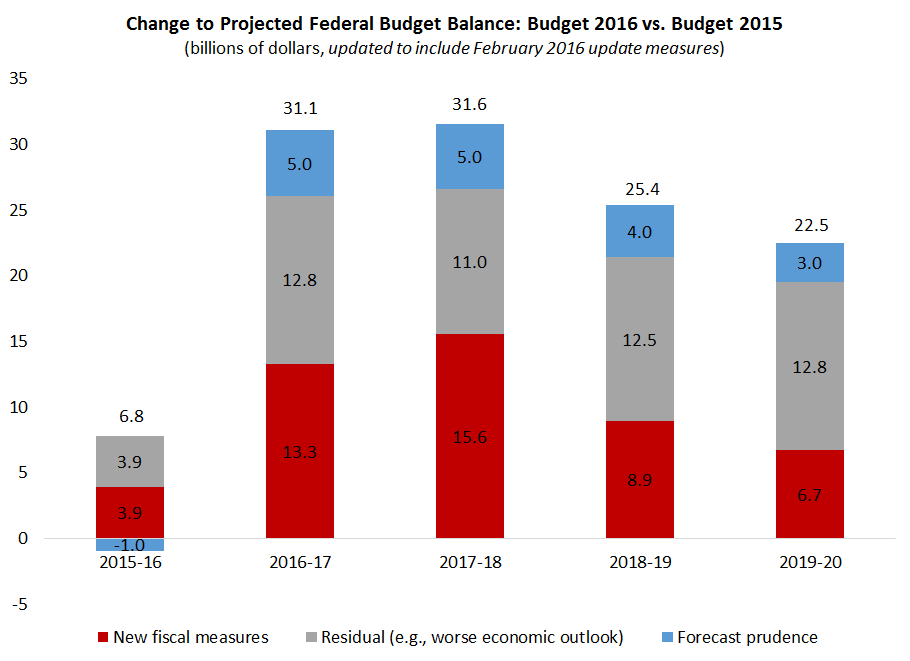
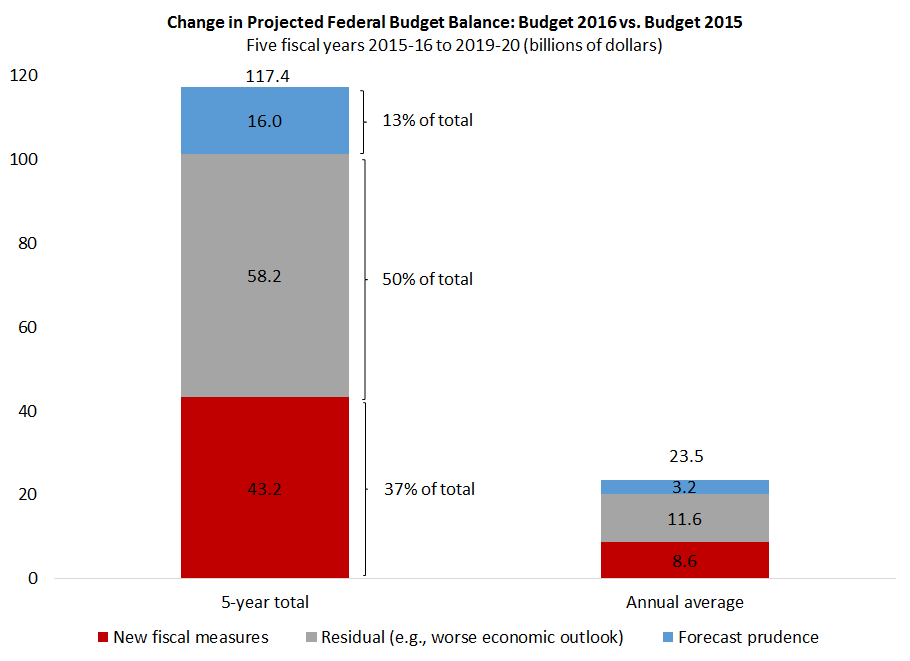
Last year, the Liberals opened the door to deficits and won the election. Budget 2016 stakes a claim to almost all of this new-found fiscal space (around $117 billion of it). This room has been freed up by running deficits that are big enough to allow for new initiatives, but not big enough that they raise the debt-to-GDP ratio over the government’s mandate. Following the money trail, here’s how I breakdown the changing deficit outlook:
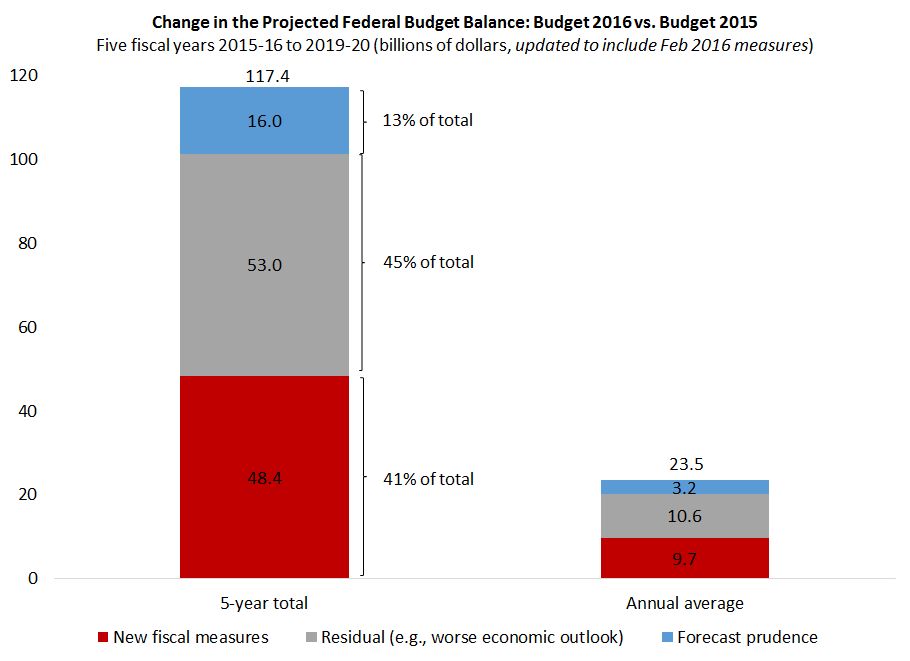
Roughly half of the bigger deficits is due to the weaker economic outlook. The hit is about $12 billion $11 billion per year on average over the projection, which is largely due to the fiscal fallout from the oil price shock. This is something that any party would have to deal with, and it means that there would likely be modest deficits ahead for any federal government in power that failed to provide a fiscal policy response.[1]
But, of course, the policy response is where the differences become clear: When faced with repeated disappointments in the Canada’s economic performance, the Conservatives typically ratcheted up spending restraint in past budgets in order to reduce the deficit. So if they were still in power, it might be possible for them to balance the books, but that would likely require another dose of spending restraint.
The Liberals are taking the opposite approach. Faced with a weaker economy they’re not scaling back their promises — if anything they’re increasing them. The fiscal costs of this approach account for over one-third of the higher deficits (37% of the total, or about $9 billion $10 billion a year). Finally, the choice to pad the forecast also makes a noticeable contribution (13% of the total, or $3 billion annually). [2]
Expressing these numbers as a share of nominal GDP on an average annual basis over the budget cycle provides a useful lens on Budget 2016: [3]
 On average, the deficit is about 1.3 percentage points of GDP higher now than in Budget 2015. New government initiatives add about 0.5% of GDP to the deficit annually. The weaker economic outlook looks like the biggest culprit behind the bigger deficit (worth 0.6% of GDP on average). Finally, additional “fiscal prudence” adds around 0.2% of GDP to the deficit.
New fiscal measures
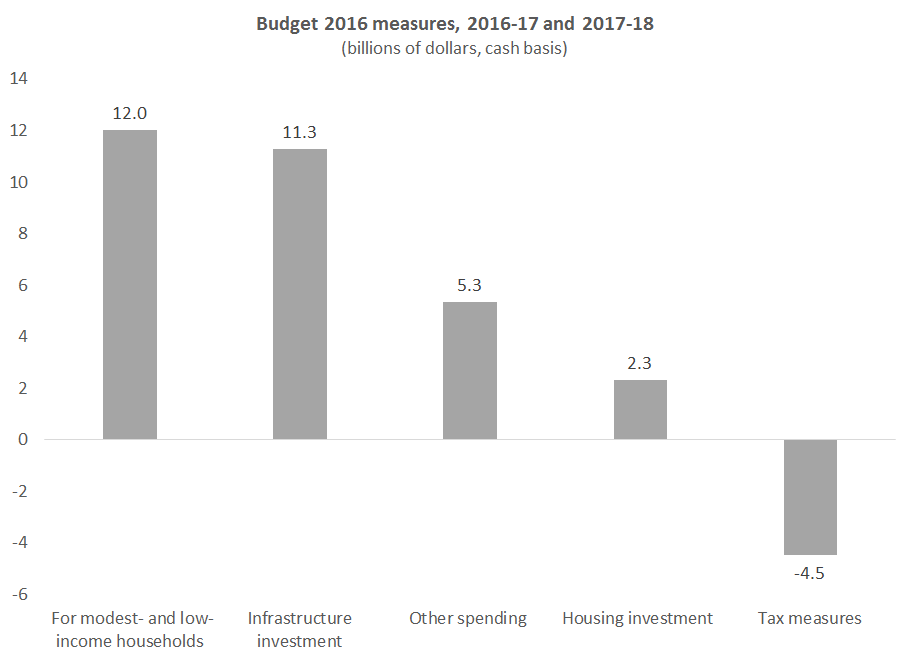
Now we can drill down to see where these new measures will be focused over the next two years. By far the two largest categories are “measures for modest and low-income households” and “infrastructure” — each of which accounts for about 45% of the net new measures.
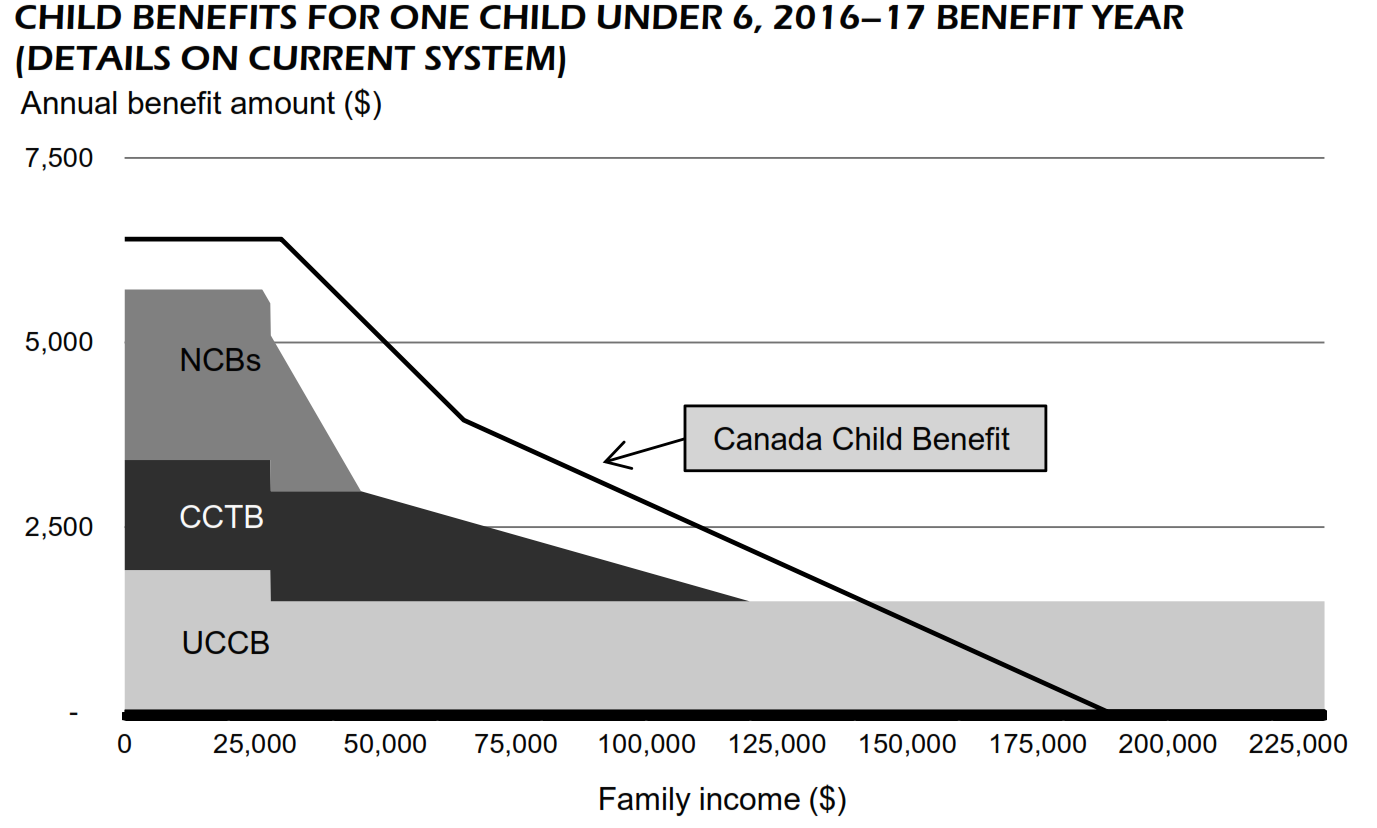
The Canada Child Benefit is a big part of the first category. It’s a major new social program that enhances and consolidates existing transfer programs. The basic idea is to target children’s benefits to lower-income households, rather than provide universal benefits to all households regardless of their income (as the Universal Child Care Benefit did).
There are other measures in the Liberal budget to support their narrative of helping the middle class and targeting lower-income individuals – the approach to funding post-secondary education and simultaneously cutting the middle-income tax rate while raising taxes on the top 1% of earners are two examples.
I’m curious whether all of these changes have collectively raised or lowered marginal effective tax rates for lower- and middle-income families, but I see no analysis in the budget on this score.
Infrastructure is the second big-ticket item in Budget 2016, with the government taking a two phase approach. The plan is to ramp up phase 1 spending, over a two-year time frame, and again in phase 2 over the next 10 years. The result is a back-end-loaded top-up to infrastructure spending.
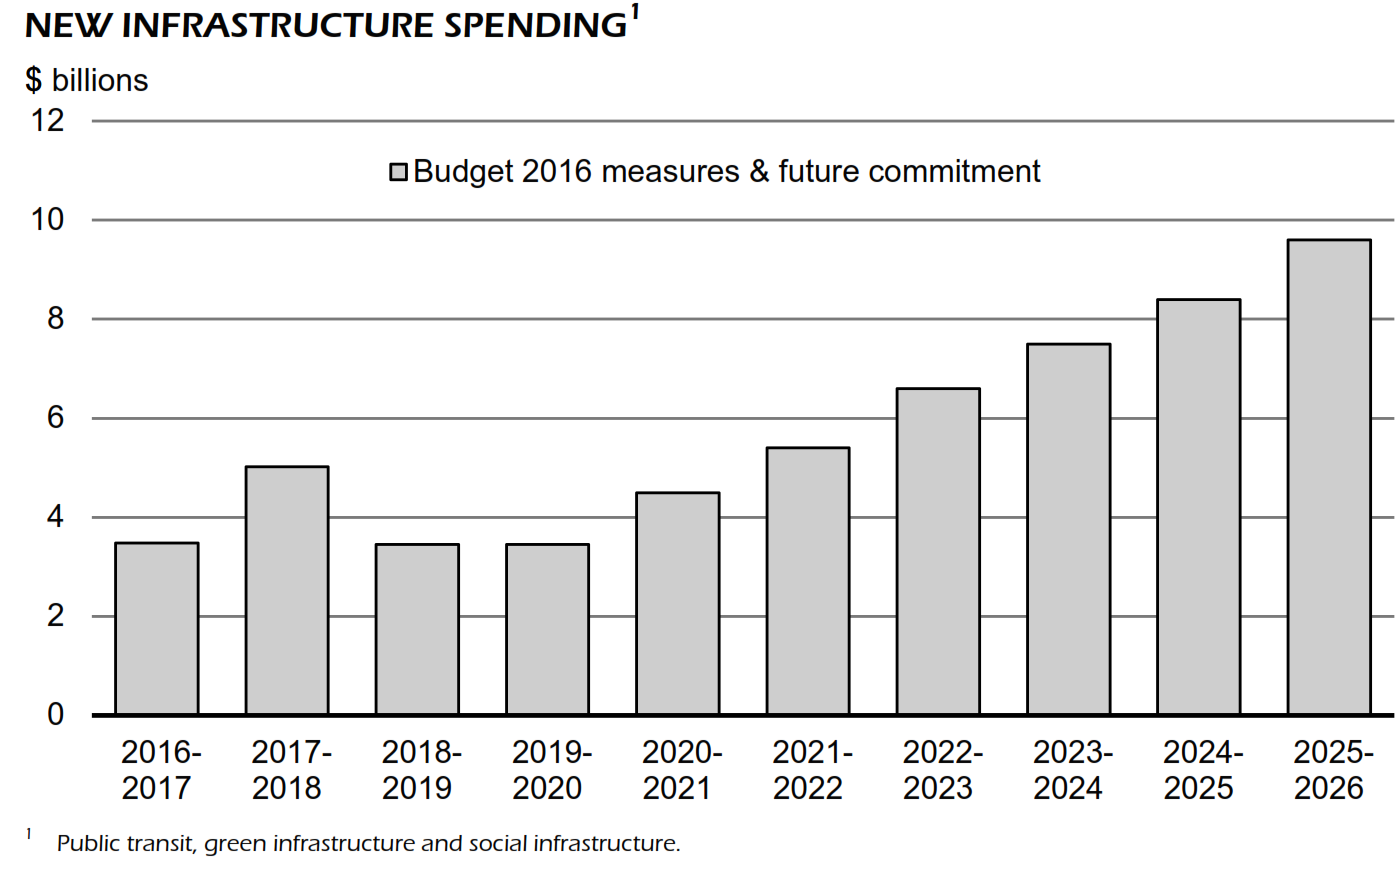
While there has been pressure to get government money out the door faster, this is sensible planning. For starters, it recognises the potentially long lead time on complex and ambitious infrastructure projects, many of which are cost shared among multiple levels of government. The government has even stopped using the word stimulus, which carries with it the expectation of “shovel-ready” projects and quick economic support.
How does Budget 2016 measure up to past big budgets?
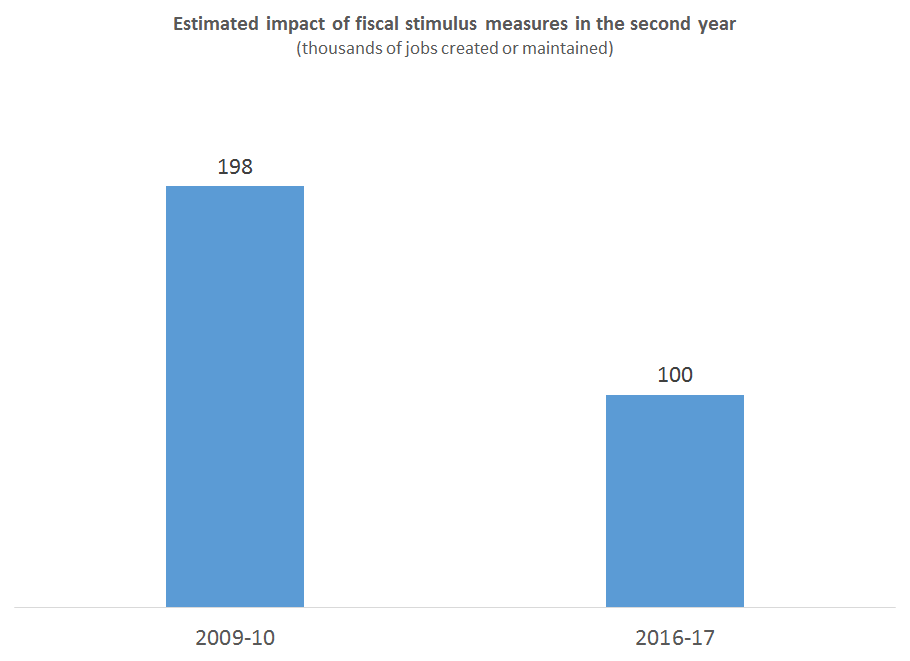
Start with Finance Canada’s analysis to compare the presumed “stimulative” effects of Budget 2016 (Annex 2), against Canada’s last stimulus budget, the 2009 Action Plan. It turns out that Budget 2016 is expected to provide about half as much support for jobs, when comparing both packages over their first two years.
 I’ll be looking to see whether the Bank of Canada’s estimates of the economic impacts of Budget 2016 (which were not yet factored into their projections) are similar to the government’s.
Fiscal multipliers (i.e, the impact on GDP that results from enacting a new program or cutting taxes) are notoriously controversial. So we can instead provide some historical context on the overall size of Budget 2016 measures relative to previous budgets in this way:
The inner workings of government
Keep track of who’s doing what to get federal policy made. In The Functionary.
The Functionary
Our newsletter about the public service.
Nominated for a Digital Publishing Award.
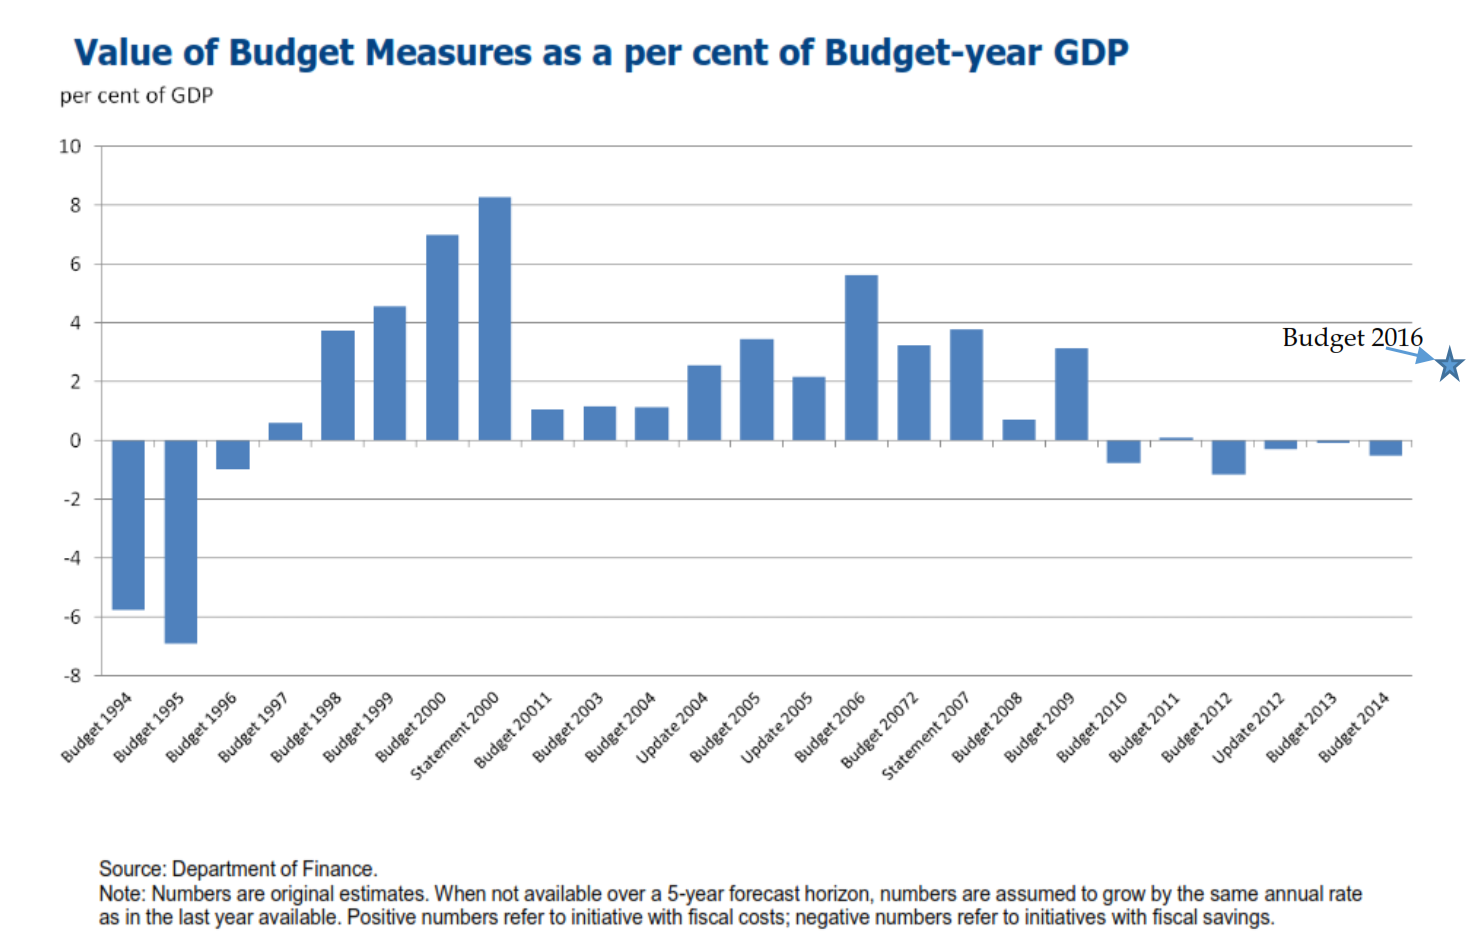 Budget 2016 measures are worth approximately 2.5% of GDP over the budget cycle. The figure above shows that there have been several larger budgets over the past two decades. For example, Budget 2016 appears to be much smaller than the payback that Canadians got after the Liberals balanced the books in the late 1990s and in 2000. And it’s also smaller than the first few Conservatives budgets in 2006 and 2007, and again in the 2009 Action Plan.
That said, Budget 2016 is still a significant package. It also matters because it’s the first time since 2010 that the federal budget is adopting an expansionary fiscal stance.
Much prudence, but some lacking budget transparency
The budget watchers I talked to in the lockup agreed that there’s plenty of extra padding built into this budget (about $6 billion annually accounted for explicitly, perhaps more elsewhere). This seems to be an effort to set a low bar for success. Presumably they are under-promising, so they can over-deliver. Given the global economic context it’s reasonable to be more cautious than usual in our budget planning, but Budget 2016 may be applying too much prudence to ensure fiscal room is available if things don’t go as planned.
Unfortunately, prudence is applied in the budget forecast by revising down the level of GDP. Rather than the old practice of having a separate line item for the “fiscal fudge factor,” they’ve spread the prudence like a virus throughout their projections. Among other things, this obscures their overarching target, the debt-to-GDP ratio. This budget opacity makes it hard — if not impossible — to remove this risk adjustment to see the true state of government’s books.
A big question is what will be done if or when they surpass the low deficit bars they’ve set for themselves. Will the government use prudence as a back door way to spend even more? This is something to watch.
There are some areas to praise in this budget. For instance, it presents new analysis on how different economic assumptions would change the resulting deficit and the debt ratio, which is useful information (“fan charts”). Unfortunately, the overall presentation and explanation of the government’s bottom line is downplayed (relegated to an Annex). This part of the budget could be much clearer, especially in light of the Liberals’ promises to be a more “open and transparent” government.
One simple way to lead on open data initiatives: include an excel file with all of the budget tables and figures in order to facilitate outside analysts’ work.
They could have also included long-term fiscal sustainability analysis. This would go a long way to address claims that the government’s fiscal position is unsustainable due to future pressures associated with aging demographics, weak productivity and rising health care costs.
There’s no evidence provided that the Canadian economy is operating below its potential. This is a crucial point in the fiscal stimulus debate, and including that evidence would have helped buttress their assumptions about the effectiveness of fiscal stimulus.
Almost all of the spending plans are presented on a two-year time frame, rather than the customary five years (investments in indigenous community initiatives and arts and culture being exceptions). This is probably because after only five months in office, there are still plenty of decisions to be made before fully articulating the fiscal plan. But providing five-year spending baselines would have insulated them against the criticism that spending will ultimately spiral out of control.
Finally, there’s little explanation of how the oil price shock is affecting the government’s fiscal situation, and how the fiscal picture has evolved since they took office and why. As of January 2016, the year-to-date surplus is more than $4 billion. This means that some effort will probably be needed for the government to get rid of this politically-inconvenient and pesky surplus that won’t seem to go away despite the weaker economy (for instance by booking items to the 2015-16 fiscal year or making other year-end adjustments). Perhaps the negative economic shock has not hurt government revenues as much as many analysts predicted. [4]
Tax review and tax credits
The good news for economists is that a government spending and tax review is planned. This should be broader in scope than simply evaluating tax expenditures, and should take into account the entire personal and business tax system.
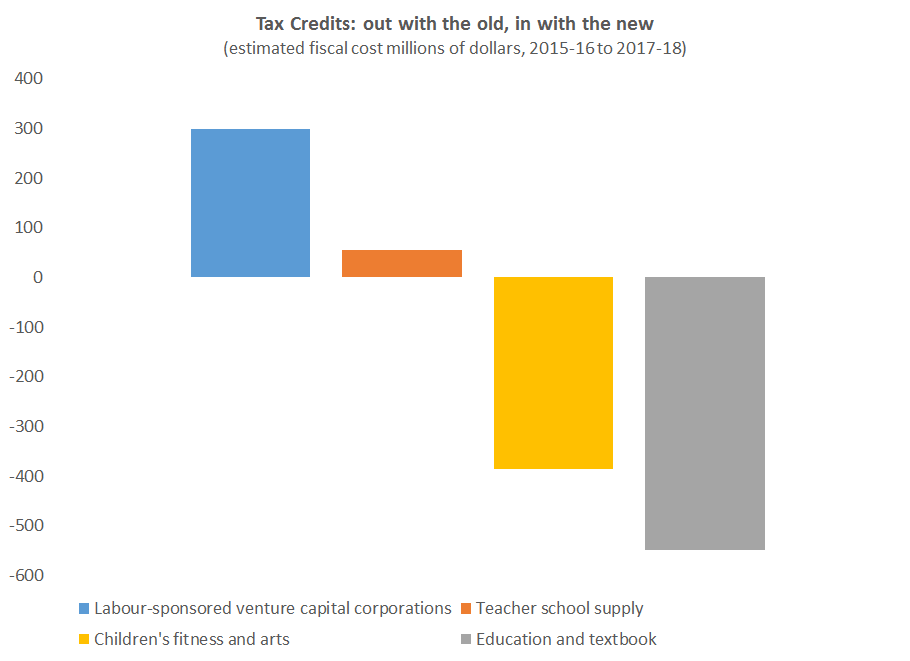
On the handling of tax expenditures, economists will be less pleased. While the budget rightly removes a few tax credits, it simultaneously brings back an old tax credit that was found to be ineffective (labour-sponsored venture capital), and creates a new one (for teacher supplies).
Some other good and bad policy changes
By temporarily enhancing employment insurance benefits in a targeted way to specific parts of the country, the budget deftly addressed worries that federal fiscal policy can’t respond quickly to a shock with different regional impacts.
However, the budget also followed through on a populist election promise to reverse the age of eligibility for Old Age Security to 65 from 67 (which the Conservatives had put in motion). Given an aging population and increased life expectancies, this is a costly step in the wrong direction. Because it’s not scheduled to take effect for quite some time, it should’ve been considered within the scope of the planned consultations to enhance Canada’s public pension (CPP) system.
**********
After years of federal spending restraint, Budget 2016 represents a change in course for Ottawa’s fiscal policy. The priorities of the new government are different. There’s more emphasis on targeting transfers to lower-income households, building infrastructure, improving the environment and supporting Indigenous people, to name a few. The past focus on spending control and balancing the books is gone, but no major tax hikes have been spelled out yet. The Liberal plan to address Canada’s longer-term challenges calls for more government not less. We’re effectively replacing efforts of fiscal restraint with efforts of fiscal stimulus. Time will tell whether this is ultimately a better approach, but one thing is clear: Budget 2016 offers a very different approach than the last budget for what ails us. Yes, a lot has changed in 11 short months.
This post has been updated to include new fiscal measures announced since Budget 2015 that were contained in the February 2016 update. The result of this change is to increase the relative contribution of new fiscal measures to the higher deficits, for 2015-16 to 2017-18, and to subsequently lower the deficit contribution from the residual category, attributed to the weaker economy. The author is grateful to Trevor Tombe and David Deault-Picard for identifying the error.
[1] Since this is calculated as a residual, it’s possible — even likely — that this over-states the size of the fiscal shock.
[2] The February 2016 update only included the cost of new measures until 2017-18. Because they aren’t reported separately in Budget 2016 Table 1 for 2018-19 and beyond, some of these will be captured by my residual “economic weakness” category, rather than being recorded as new fiscal measures.
[3] Looking now at the four fiscal years ahead in the new government’s mandate, when much of the new policy action will take effect.
[4] I’m left with a lingering feeling that maybe the economic impacts I showed up above are also picking up a fair bit of caution and, expectations by Finance (which may or may not be realized) that the lagged effects on government revenues of the weaker economy will eventually show up.

