


After a generation of comparatively high corporate income tax (CIT) rates, in the late 1980s Canadian governments at the federal and provincial levels began a series of corporate income tax reforms. According to many mainstream (‘neoclassical’) economists, reducing CIT rates was a wise public policy. A reduced CIT rate means a reduction in the cost of capital, thus inducing a greater supply of capital. And because investment is a key driver of growth, reducing CIT rates leaves firms more (after-tax) earnings to plough into growth-expanding industrial projects. Did the halving of the Canadian CIT rate spur higher levels of investment and more rapid growth?

The inner workings of government
Keep track of who’s doing what to get federal policy made. In The Functionary.
The Functionary
Our newsletter about the public service.
Nominated for a Digital Publishing Award.
The short answer is no: far from improving economic outcomes, there is evidence to suggest that corporate income tax reductions depressed Canadian GDP growth. I present a detailed explanation of why that’s the case in a forthcoming study to be published by the Canadian Centre for Policy Alternatives. Given the election debate around raising the CIT rate, I thought it worthwhile to summarize my findings. The study contrasts three Canadian corporate income tax rates—the effective federal CIT rate (from 1926), the combined Canadian statutory CIT rate (from 1949) and the weighted average effective rate on the top 60 Canadian-based firms (from 1950)—with five growth variables, namely investment in fixed assets, employment, GDP per capita, labour compensation and productivity. I conclude that there is no empirical or statistically significant relationship between CIT regime and growth. Business investment is a key determinant of GDP growth, employment and labour compensation, but over the long-term it is unresponsive to changes in the statutory or effective CIT rate.
Consider Figure 1, which plots the combined statutory CIT rate for Canada and the weighted average effective CIT rate on the largest 60 Canadian-based firms (ranked annually by equity market capitalization). The first round of significant corporate income tax reform came in 1988, spearheaded by the Brian Mulroney Progressive Conservatives. Federal rates fell from 36 percent to 29 percent. The second round of corporate income tax reform came in 2001 with the Jean Chretien Liberals, which saw the federal statutory rate reduced from 28 percent to 22 percent in 2004 (where the rate already stood for manufacturing, resources and other ‘trade sensitive’ sectors).
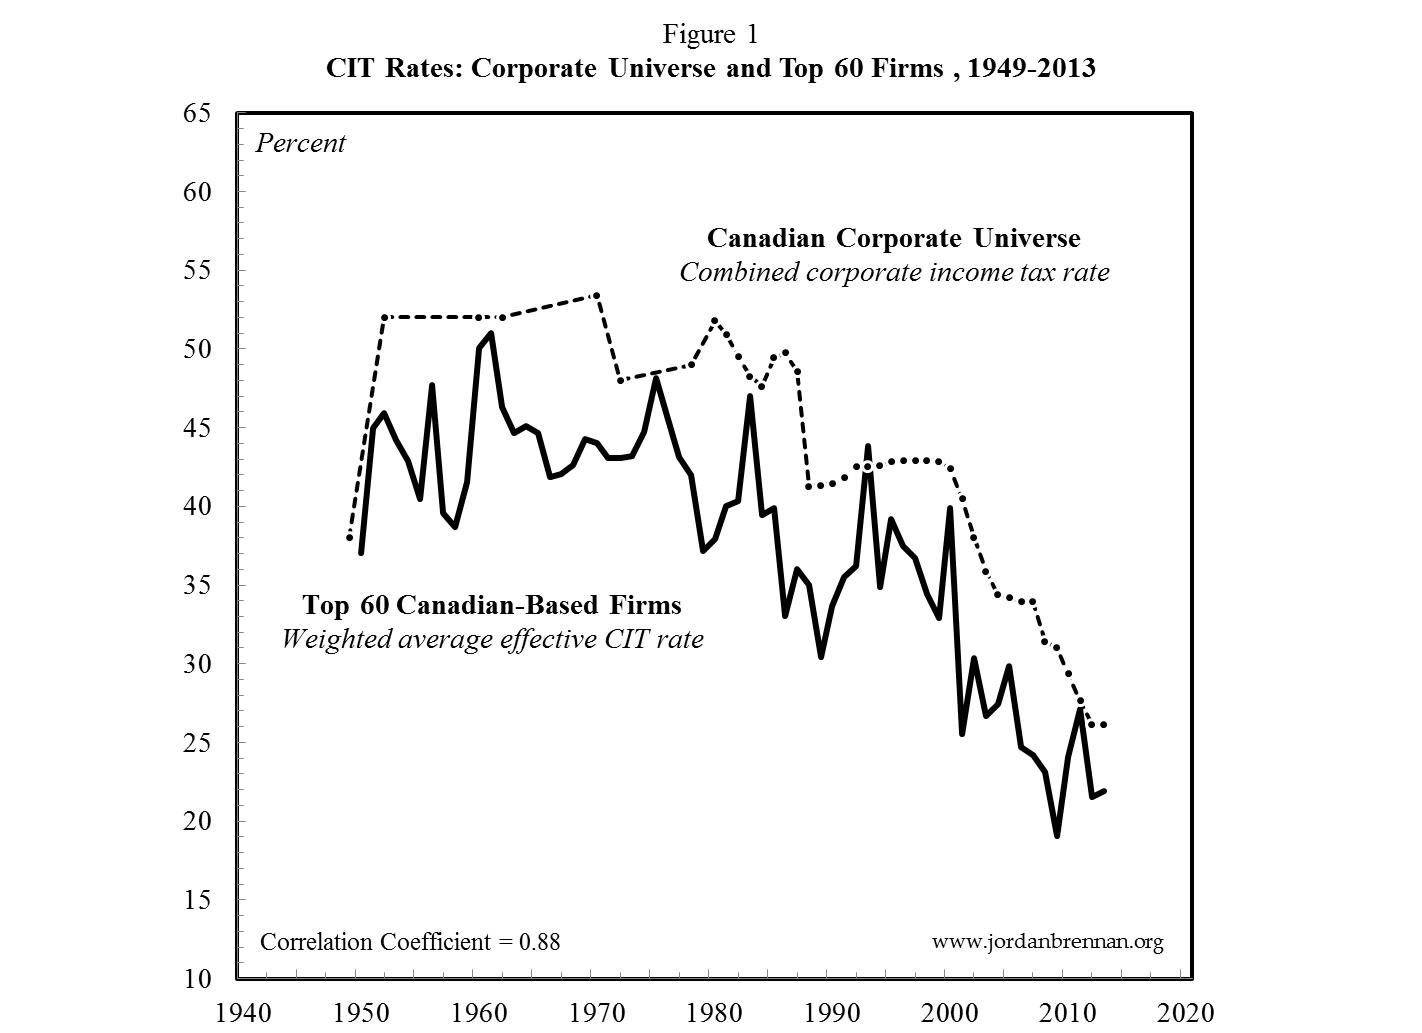
The most recent round of corporate income tax reform was initiated by the Stephen Harper Conservatives in 2008, which saw a straight reduction to the statutory rate. In a five-step reduction program, statutory federal CIT rates fell from 21 percent in 2007 to 15 percent by 2012 (excluding the surtax of 1.1 percent, which was also scrapped by Harper). Over the past three decades the provinces have also taken a kick at CIT rate reduction can, cutting the statutory rate from an average of 14 percent in the late 1990s to 11 percent more recently. Both CIT rates in Figure 1 have been halved in the past three decades, with the bulk of the reduction coming since 2001. Did these reforms spur higher levels of investment and more rapid GDP growth?
Figure 2 plots the deep history of Canadian GDP growth and business investment in fixed assets. The decade average rate of GDP growth is adjusted for inflation and population and the decade average level of fixed asset investment is measured as a percentage of GDP. Even though CIT rates began to be reduced in the 1980s, the 1990s and 2000s performed worse in terms of economic growth, not better.
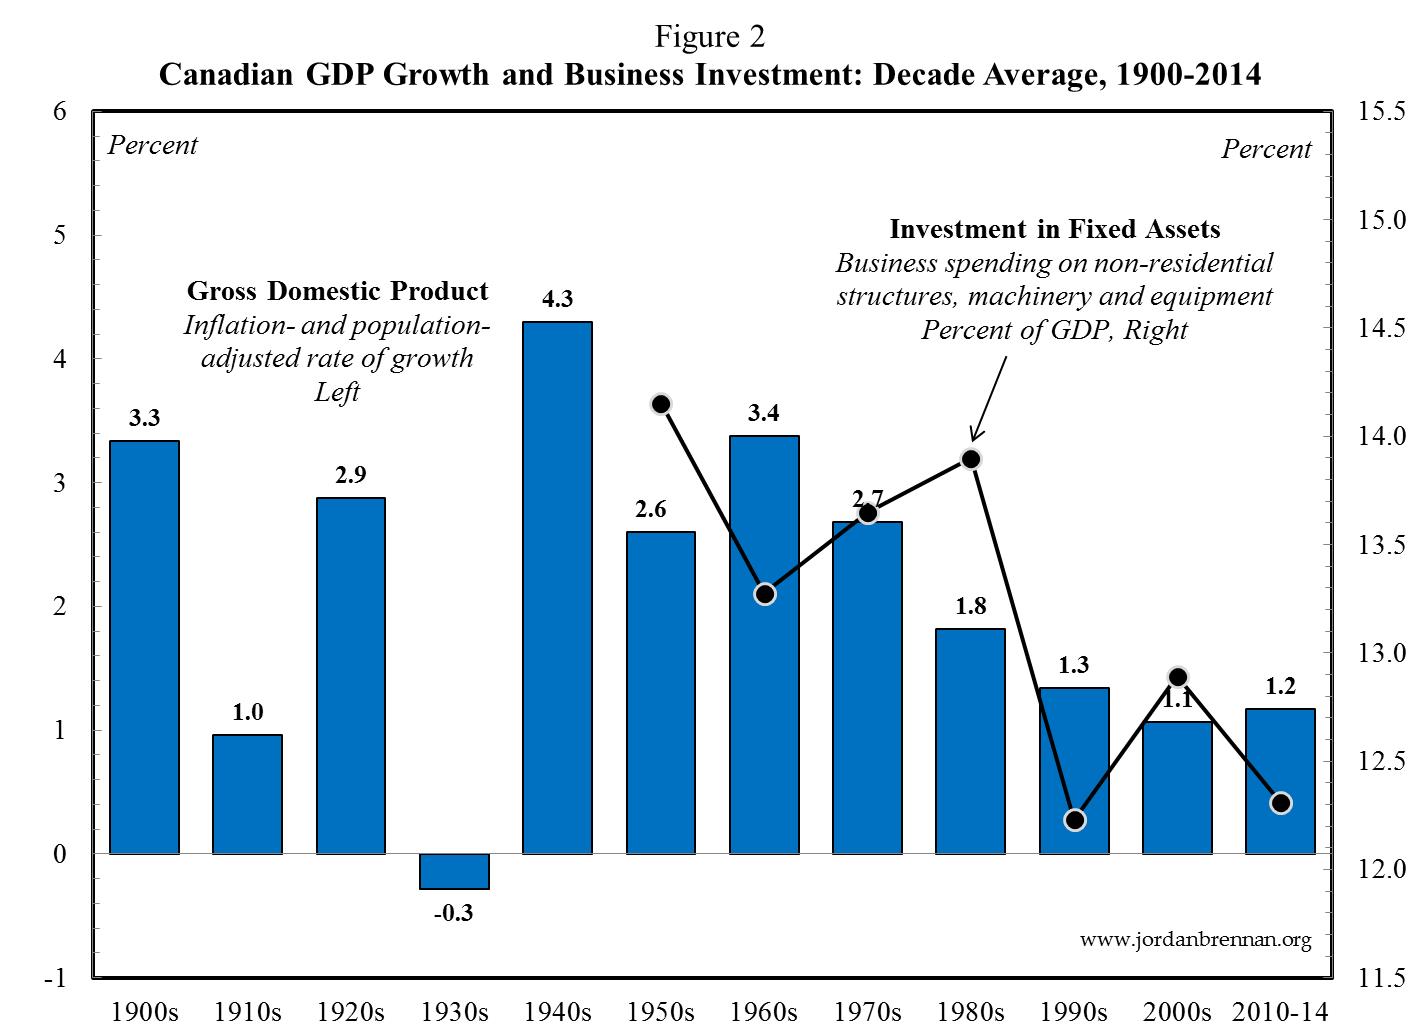
The first few decades of the postwar era experienced an upward trend in investment. Significantly (and ironically), not only has investment failed to increase in recent decades in tandem with CIT rate reductions, the pattern that investment takes mirrors the CIT rate. Far from the CIT regime and growth being strongly and inversely related, there appears to be a positive association between the two variables, such that CIT rate reductions are historically associated with lower levels of investment.
Fixed asset investment averaged 13.7 percent of GDP in the postwar decades to 1980, but in the past three decades (whilst governments were fixated with corporate tax cuts) business investment fell to an average of 12.8 percent of GDP. In sum, when we contrast the experience prior to the CIT rate reduction era (1945–1988) with the CIT rate reduction-obsessed era (1988–2012), we see a move from heightened industrial capacity expansion and relatively robust GDP growth to capacity stagnation and the slowest GDP growth in post-Depression history.
The inner workings of government
Keep track of who’s doing what to get federal policy made. In The Functionary.
The Functionary
Our newsletter about the public service.
Nominated for a Digital Publishing Award.
Not only did Canadian CIT rate reductions fail to lead to faster growth, my study unearthed evidence which suggests that CIT rate reductions contributed to slower growth. By reducing CIT rates, Canadian governments contributed to the increased income position of large firms. Rather than investing their enlarged earnings into expansionary industrial projects, Canada’s corporate sector—especially its largest firms—have increasingly stockpiled cash on their balance sheet. This ‘dead money’, as former Bank of Canada Governor Mark Carney put it, is one ingredient in the heightened stagnation of recent times.
Figure 3 contrasts the income position of the top 60 Canadian-based firms, measured as net profit divided by GDP, with corporate cash—the latter measured as domestic and foreign currency and deposits as a percent of the total assets amongst all private non-financial corporations. The two series are tightly intertwined over half a century. The fact that Canada’s largest corporations have doubled their income share in the past two decades in tandem with excessive cash hoarding indicates that the growth of corporate power itself might be one determinant of cash stockpiling, and hence, of slower growth.
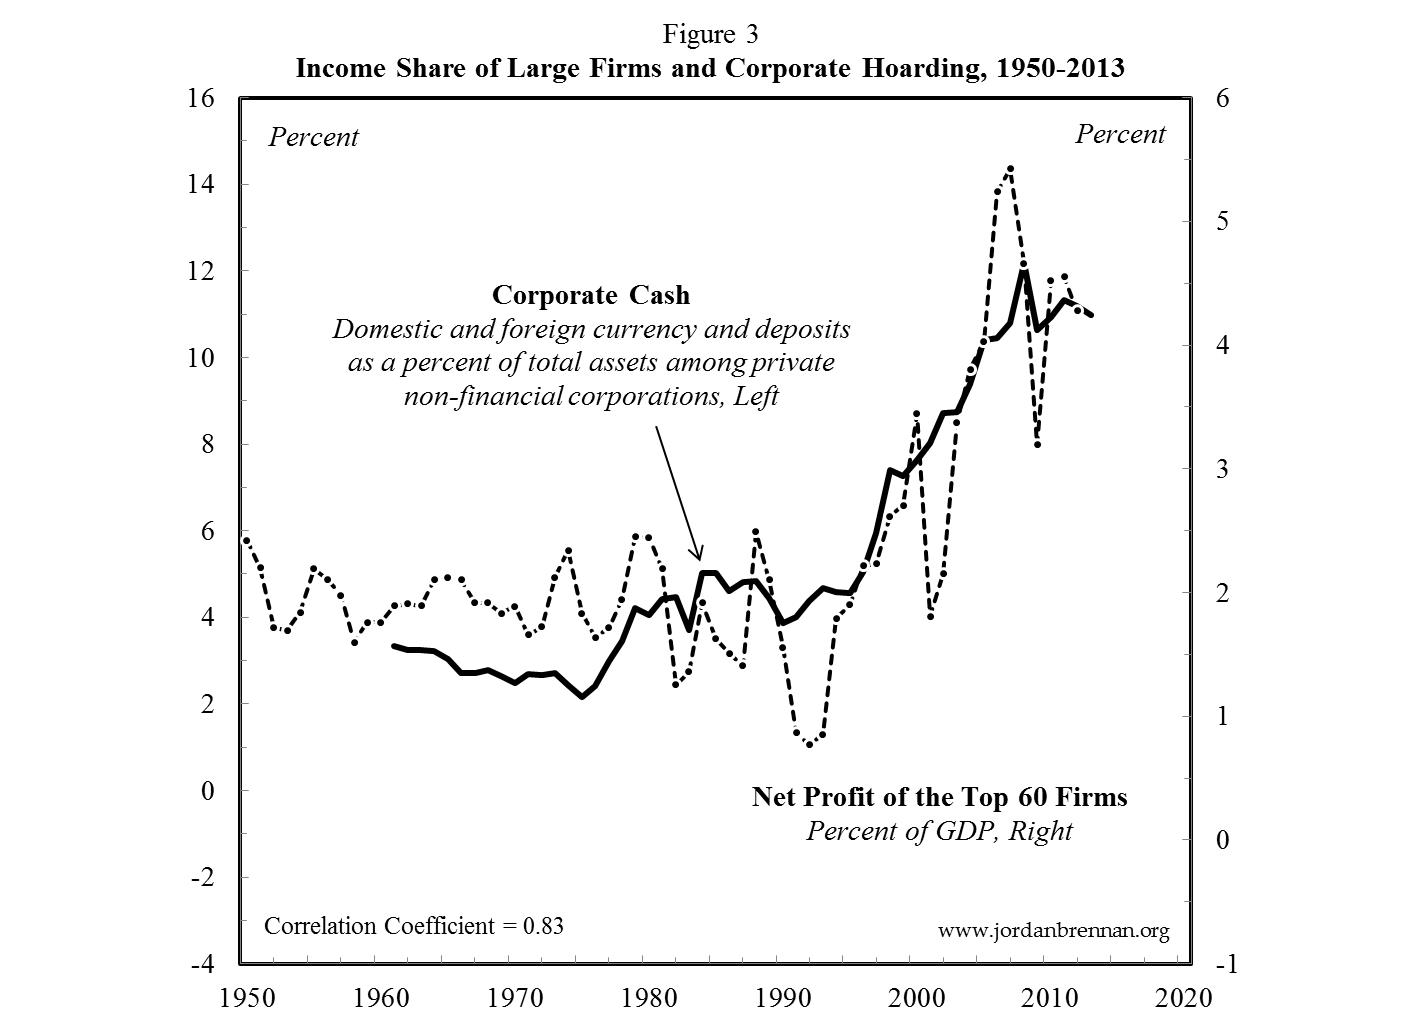
As the leading firms claim a larger share of national income through enhanced size and market power, their capacity to stockpile cash increases. By hoarding cash these firms stabilize dividend payments, thus reducing risk, and this leaves them with more liquidity for acquisition activities and to hedge against market downturn. One consequence of the stockpiling of cash, then, is that a smaller share of national income is deployed to expand employment and industrial capacity.
There is another aspect to this story that bears investigation. The income share of the largest firms captured in Figure 3 is net of corporate income taxes. This means that the effects of changes in the CIT regime are built into the picture. If the hoarding of cash by large firms in an ingredient in slower growth, what is the relationship between the CIT regime and corporate hoarding? Figure 4 contrasts the level of corporate cash with the weighted average effective CIT rate on the top 60 firms. Note that the CIT rate is positioned on an inverted scale to facilitate its comparison with the level of cash.
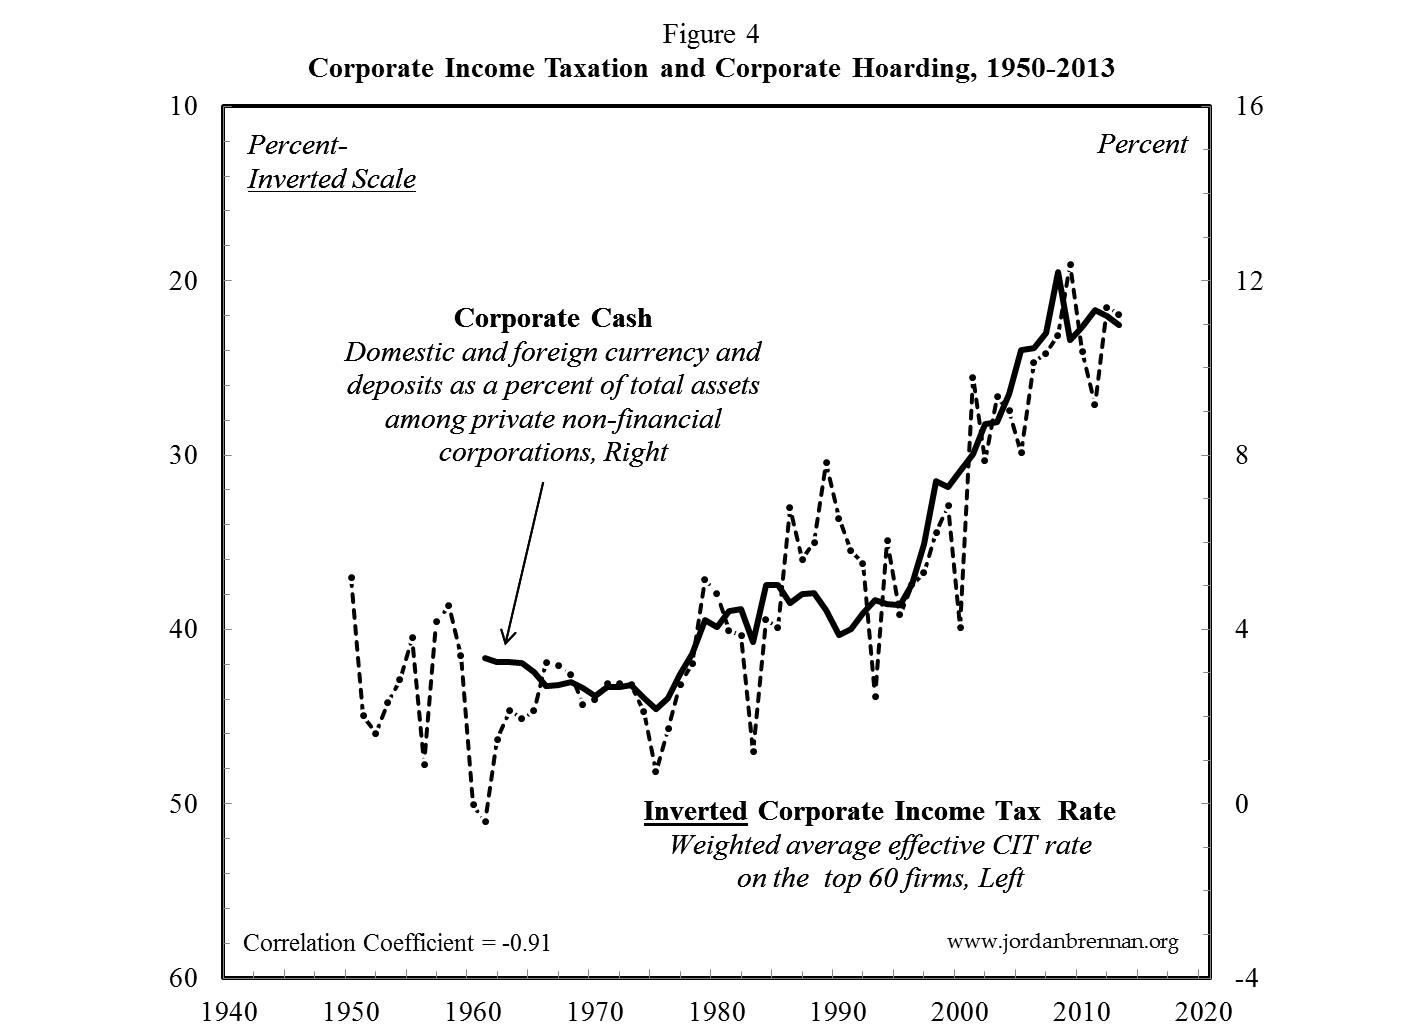
There is a very tight, persistent and negative relationship between the level of corporate cash and the CIT rate. With every reduction in the CIT rate, rather than investing its enlarged earnings into expansionary industrial projects, corporate Canada stockpiled an ever greater proportion of cash on its balance sheet. This means that, counterintuitively, the government frenzy for CIT rate reductions has exacerbated corporate cash hoarding and depressed growth.
Despite being factually supported, this line of reasoning is entirely at odds with neoclassical doctrine. If the findings contained in the forthcoming CCPA paper are true, then corporate tax cuts will go down as one of the great Canadian public policy blunders of the past generation. Far from spawning higher levels of investment and growth, the government fixation with corporate tax cuts has indirectly fostered slower growth.
Jordan Brennan is an economist with Unifor and a research associate of the Canadian Centre for Policy Alternatives. Follow him on Twitter @JordanPWBrennan. An attenuated version of this post can be found on the CCPA’s ‘Behind the Numbers’ series.