


The latest Treasury Board (TBS) report, Employment Equity in the Public Service of Canada 2014-15, provides useful information regarding the relative representation of employment equity groups: women, Indigenous peoples, visible minorities and persons with disabilities. Overall, the public service is reasonably diverse for the three groups which are the subject of this article — women, visible minorities and Indigenous peoples.
Unlike Labour Canada’s Employment Equity Act: Annual Report 2015, the TBS report does not present how representation has improved over time. To provide some historical context, this article contrasts the 2014-15 report with the 2007-8 TBS report with respect to overall representation, as well as diving into some of the 2014-15 numbers.

The inner workings of government
Keep track of who’s doing what to get federal policy made. In The Functionary.
The Functionary
Our newsletter about the public service.
Nominated for a Digital Publishing Award.
In contrast to earlier TBS reports, the current report only provides a summary analytical narrative for its data tables (one page, compared to over 10 previously), with fewer data tables (six compared to 16).
The following charts and narrative aim to fill that gap and help tell the overall story. While representation for all employees has improved, visible minorities and Indigenous people are relatively less well represented at the executive level, particularly at the Assistant Deputy Minister level (EX4-5).
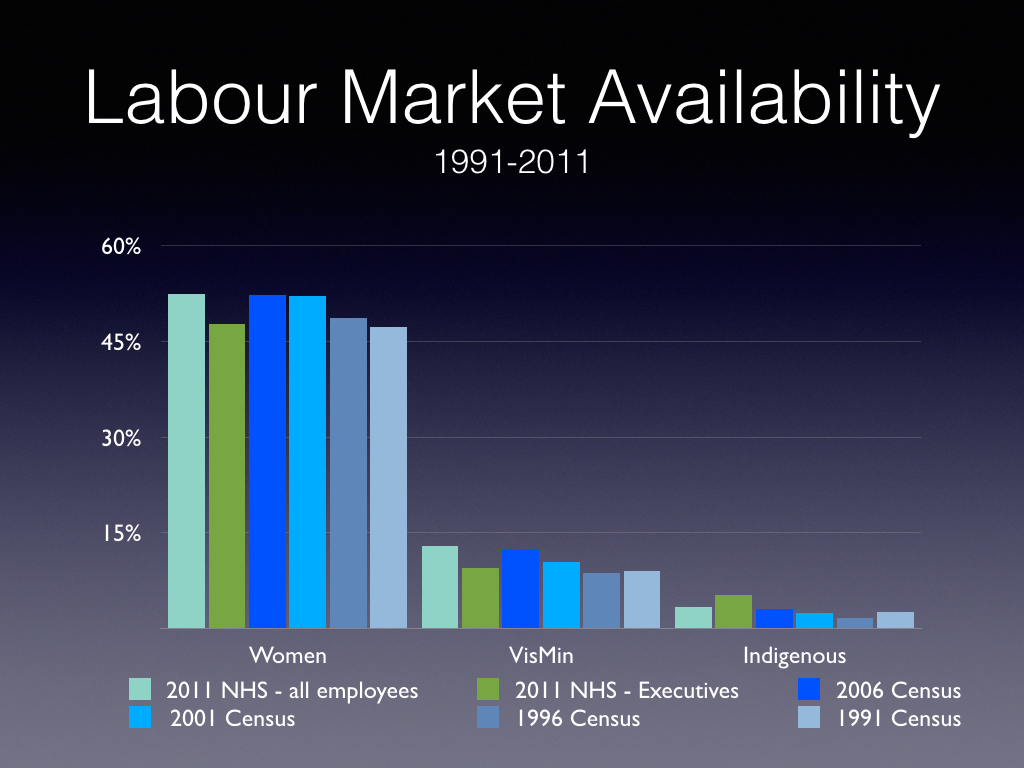
Labour Market Availability (LMA) refers to the number of people in the workforce from which employers could hire. Chart 1 shows the representation of different kinds of workers who would be available to work in the public service. For example, the 2011 National Household Survey showed that of the workers available to be employed by the public service, 52.5 per cent were women.
While the LMA for women has largely plateaued, the number of visible minority and Indigenous people in the labour market available for public service jobs increased by 31 percent in the past 20 years.
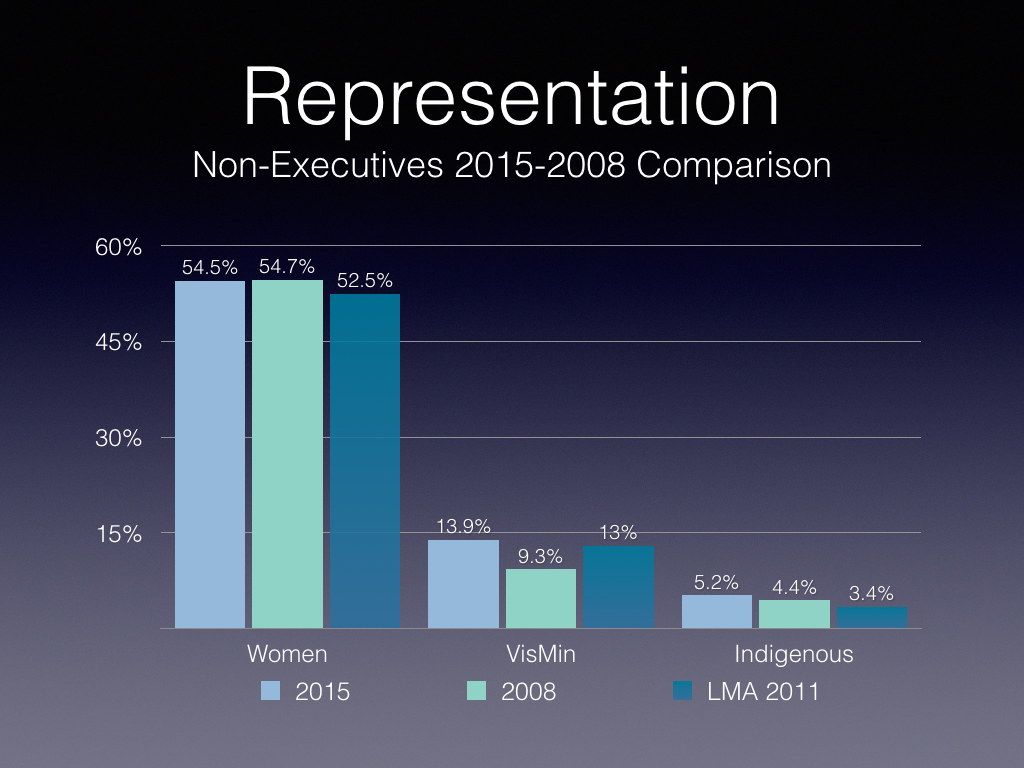
Chart 2 compares the employment equity numbers for all non-executive public servants in 2015 and 2008.
Women’s representation remained stable, and slightly greater than their Labour Market Availability numbers, with more significant increases for visible minorities (46 percent) and Indigenous people (23 percent), over the LMA.
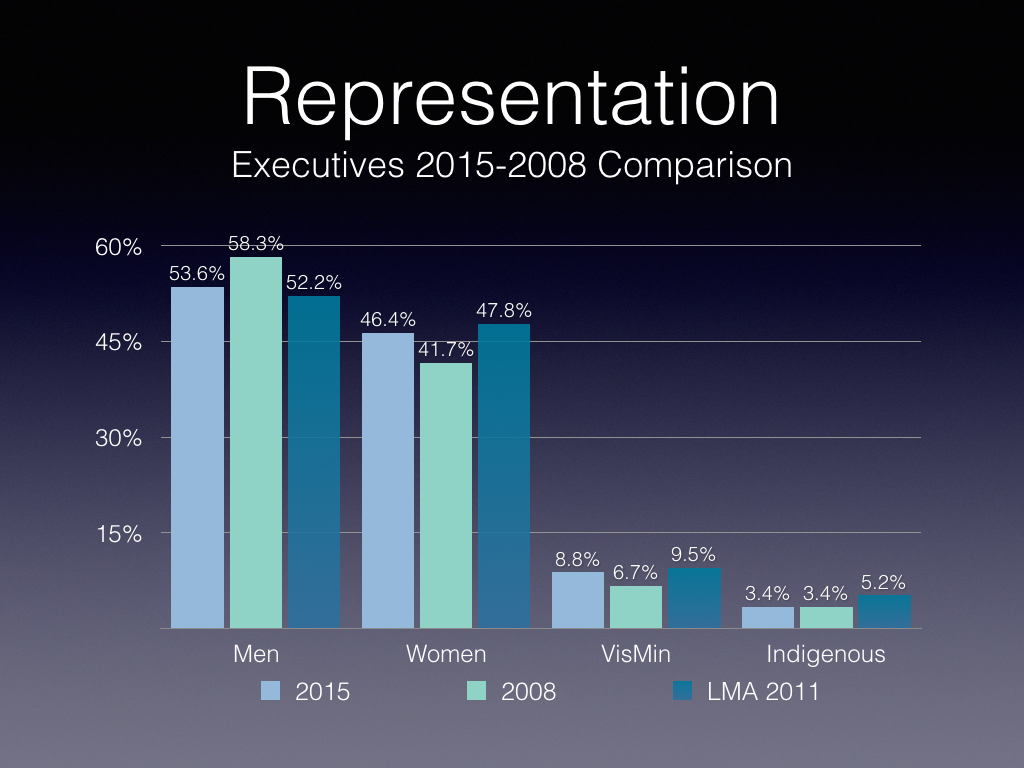
Chart 3 shows the diversity of executives (EX1-5 levels), again comparing 2015 and 2008. We generally see a slight under-representation vis-à-vis the labour market availability, except for a larger gap with respect to Indigenous peoples.
Women’s executive representation has increased by 11 percent, visible minority representation by 31 percent, but that of Indigenous peoples has remained flat.
For comparison purposes, we have included data for men, showing a relative shift towards more women executives in the past seven years.
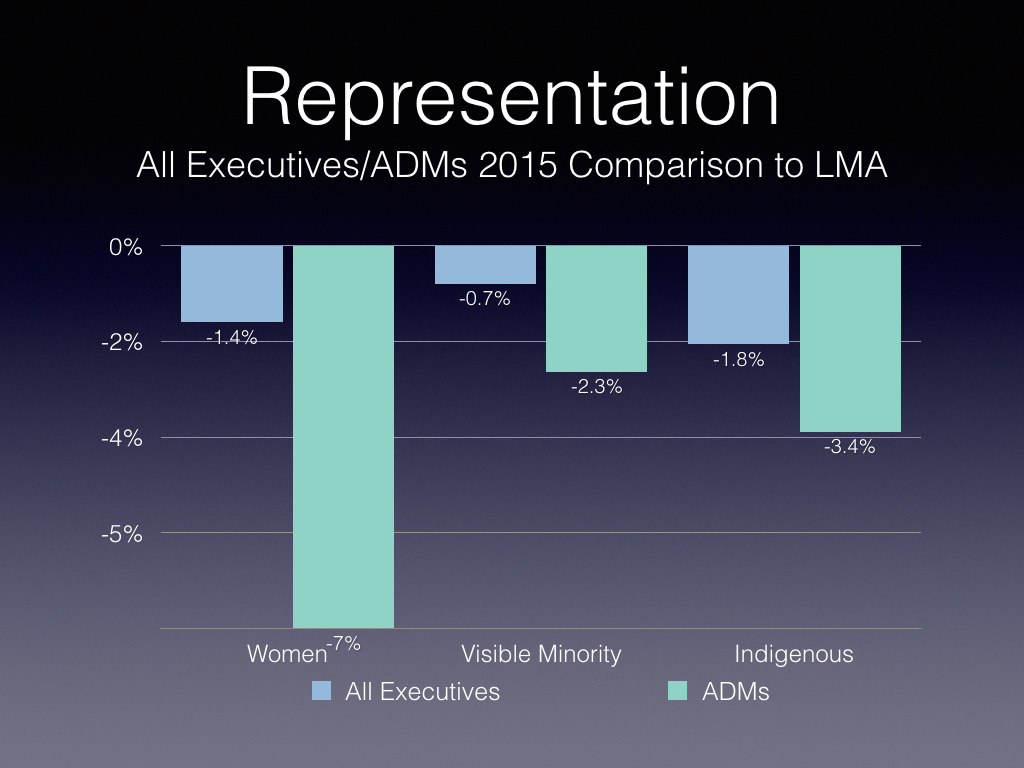
Chart 4 dives a little deeper into the numbers. It looks at the disparity between the representation of the different groups at the executive level versus the Labour Market Availability, but then also zeroes in on the assistant deputy minister (ADM) level (EX-4/5).
Hopefully, the numbers mean that the feeder group for ADMs (EX1-3 levels) are more diverse than current ADMs, meaning that over time, diversity of ADMs should increase.
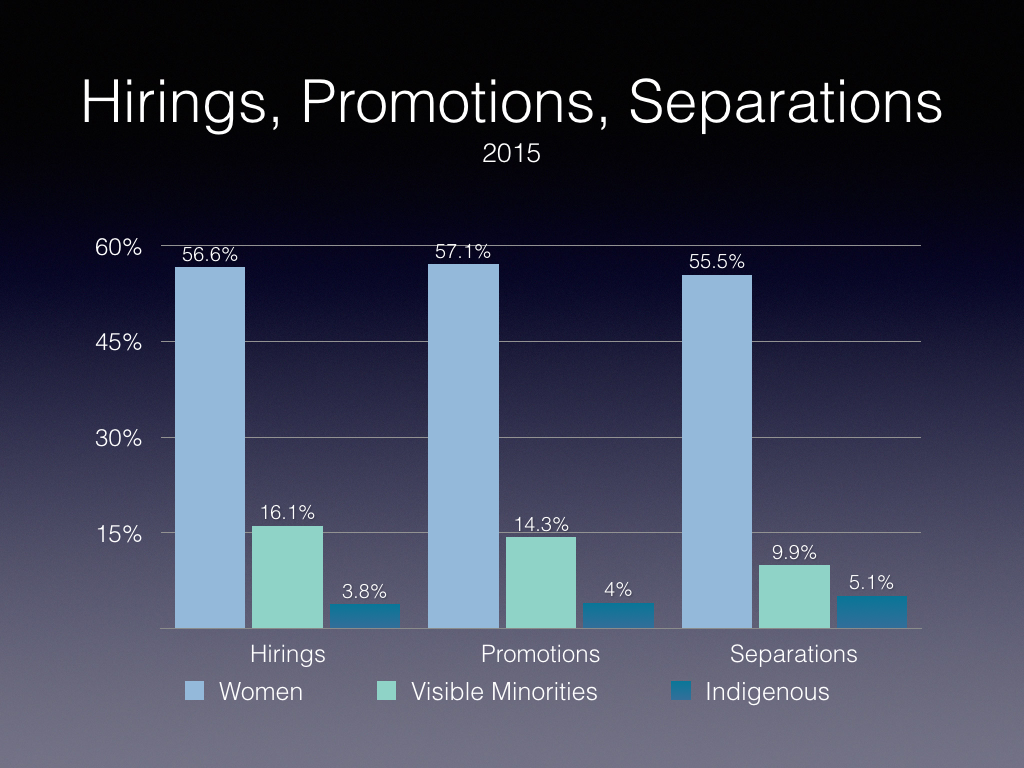
Chart 5 presents the data regarding hirings of new public servants, promotions of current public servants, and separations or departures of current public servants.
Contrasting hirings and separations, women are being hired slightly more than they are leaving (1.1 percent), visible minorities are being hired significantly more (6.2 percent) and Indigenous people being hired in smaller numbers than separations (1.3 percent).
With only 3.8 percent hirings of Indigenous people compared to 5.1 percent separations, this could portend a decline in representation.
All groups are being promoted at a percentage higher than their Labour Market Availability.
The net effect is to increase growth in representation of visible minorities compared to the other groups.
The inner workings of government
Keep track of who’s doing what to get federal policy made. In The Functionary.
The Functionary
Our newsletter about the public service.
Nominated for a Digital Publishing Award.
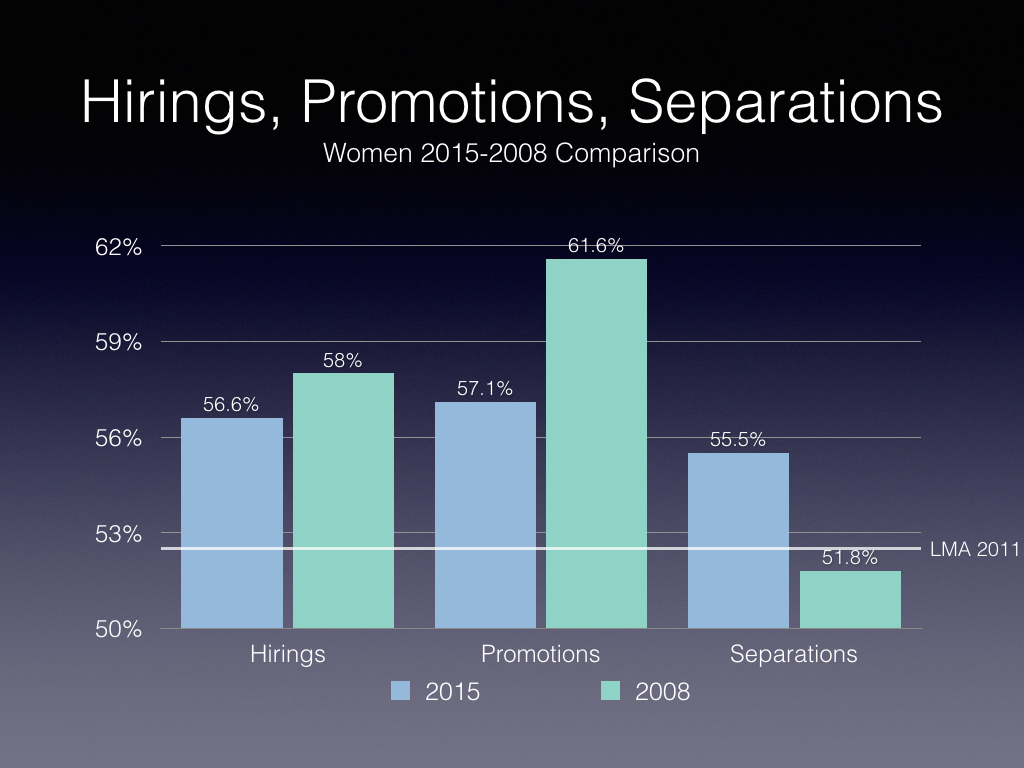
Chart 6 contrasts 2015 with 2008 data. We see that women are over-represented compared to their 2011 Labour Market Availability in hirings, promotions and separations. In other words, the rate of increase in women’s representation has not yet plateaued.
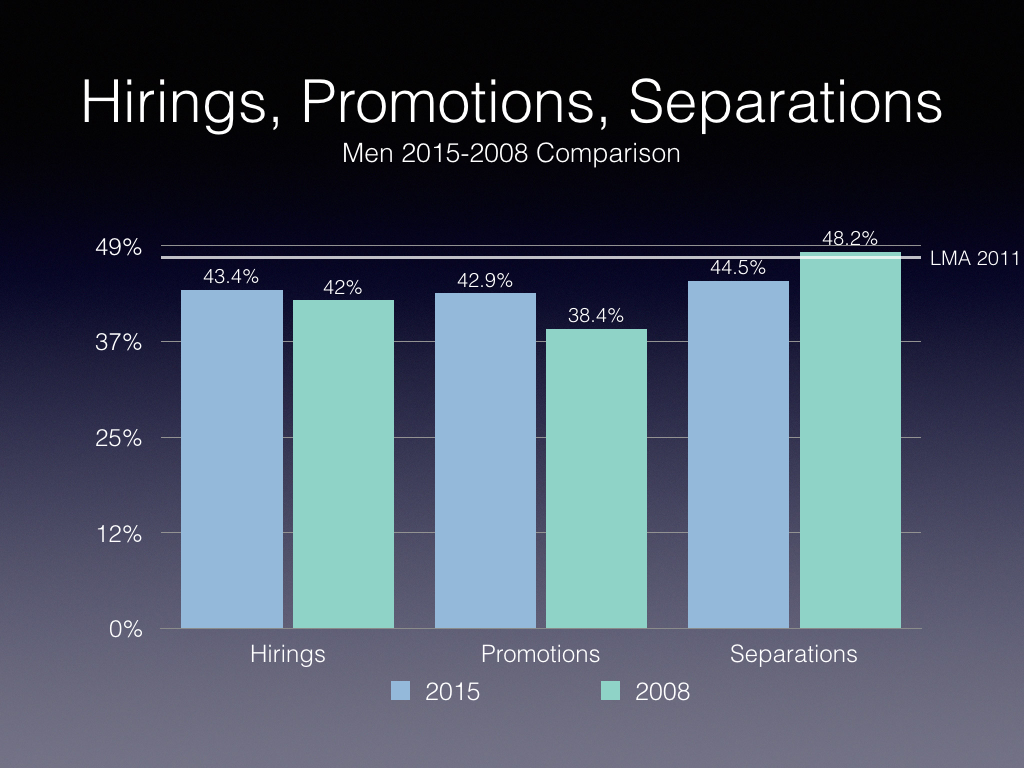
For a different perspective, Chart 7 looks at employment equity with respect to men, again contrasting 2015 with 2008 data. Men are under-represented compared to their 2011 labour market availability in hirings, promotions and separations (save in 2015 for separations).
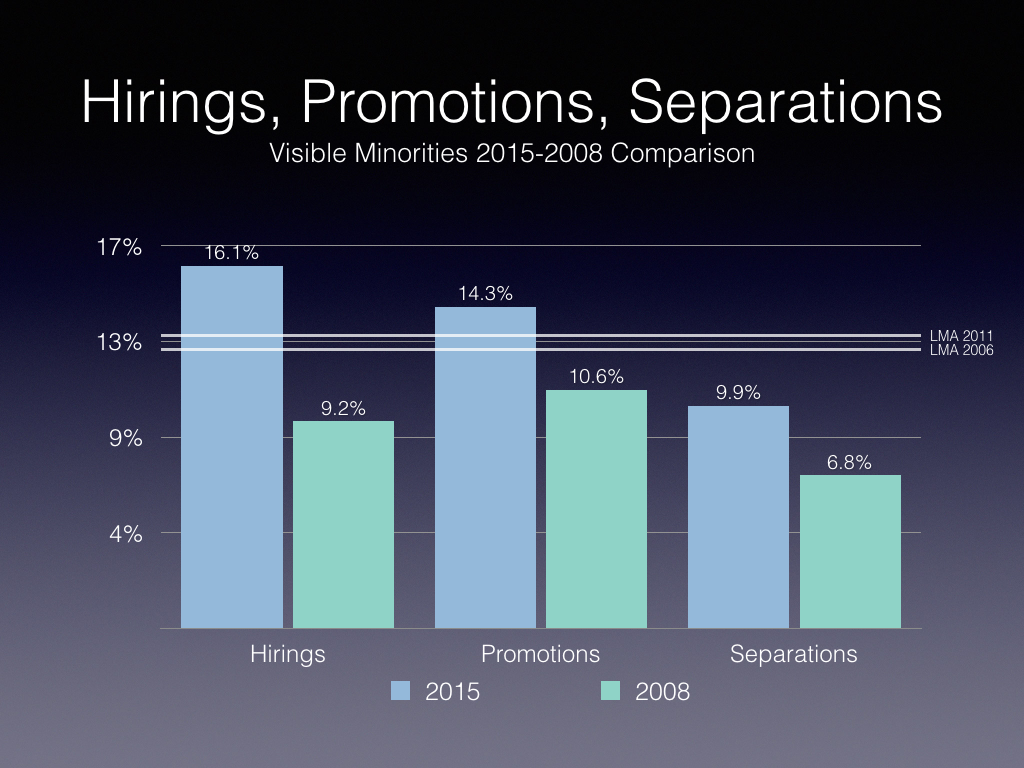
For visible minorities, Chart 8 contrasts 2015 with 2008 data, showing that visible minorities are over-represented in 2015 compared to LMA 2011 in hirings, and promotions, and under-represented in separations. However, in 2008, visible minorities were under-represented in all three measures, highlighting a significant improvement.
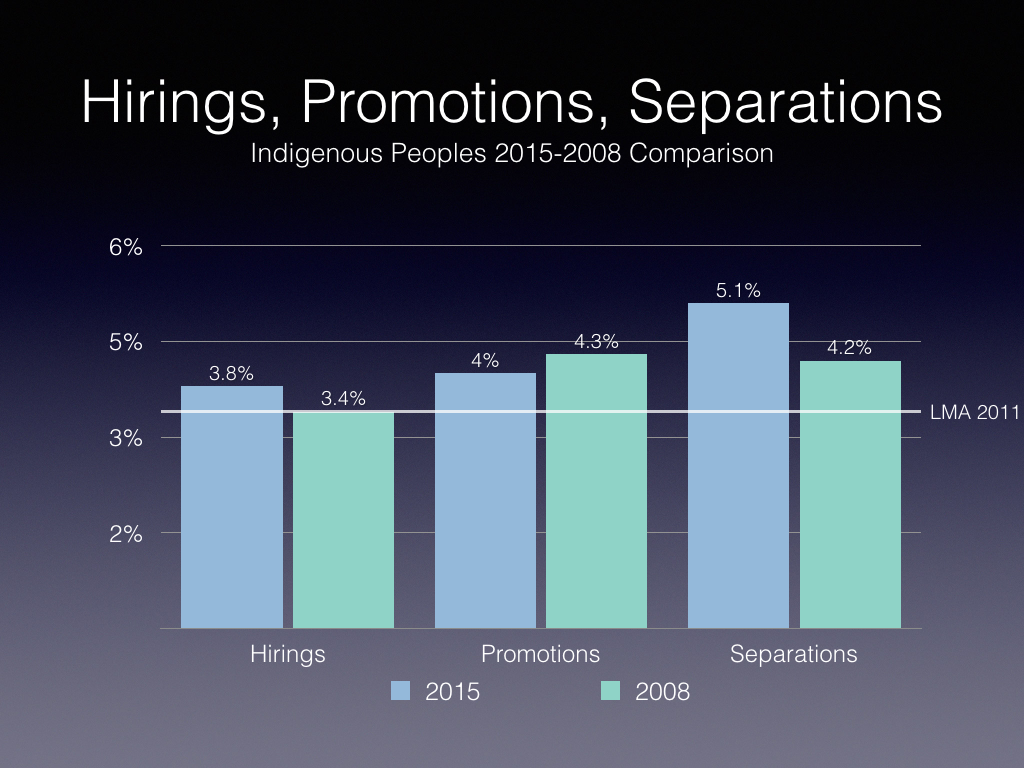
For Indigenous people, Chart 9 contrasts 2015 with 2008 data, showing that Indigenous peoples are over-represented compared to their 2011 labour market availability in hirings, promotions and separations, with 2008 hirings greater than 2006 LMA of 3.0 percent.
However, it would appear that there are retention problems with respect to Indigenous people given that more left in both 2015 and 2008 than were hired, as well as compared to their LMA of 3.4 percent.
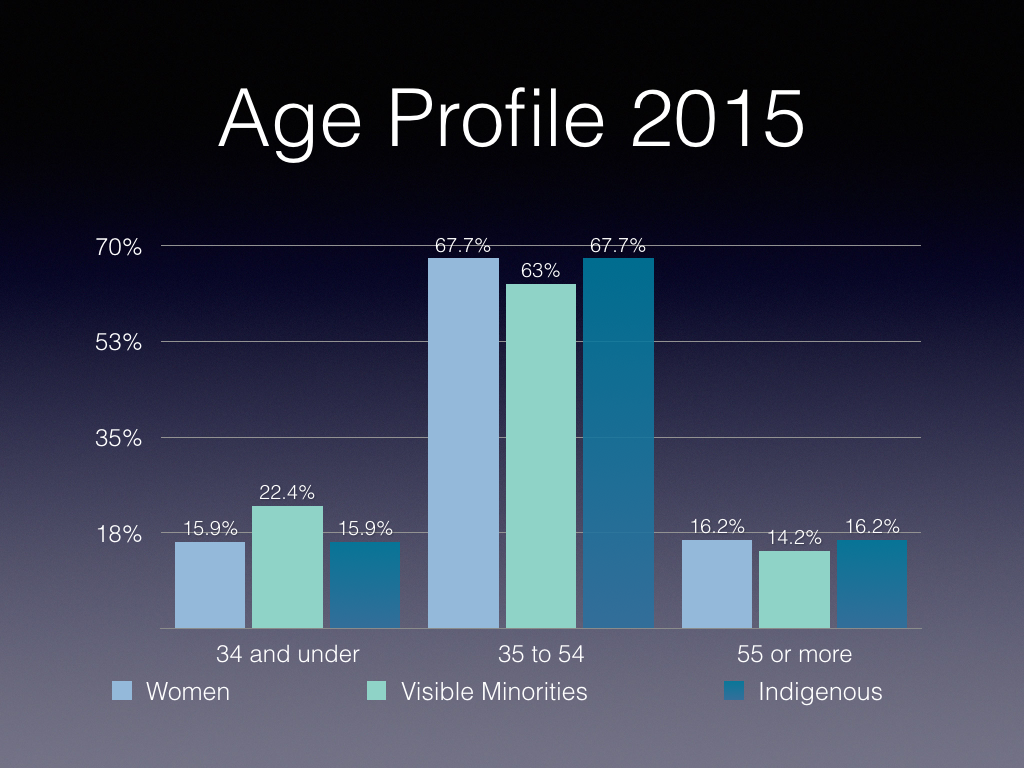
Looking at public servant age profiles in Chart 10, visible minority public servants are relatively younger than the other groups, suggesting that their numbers will continue to grow.
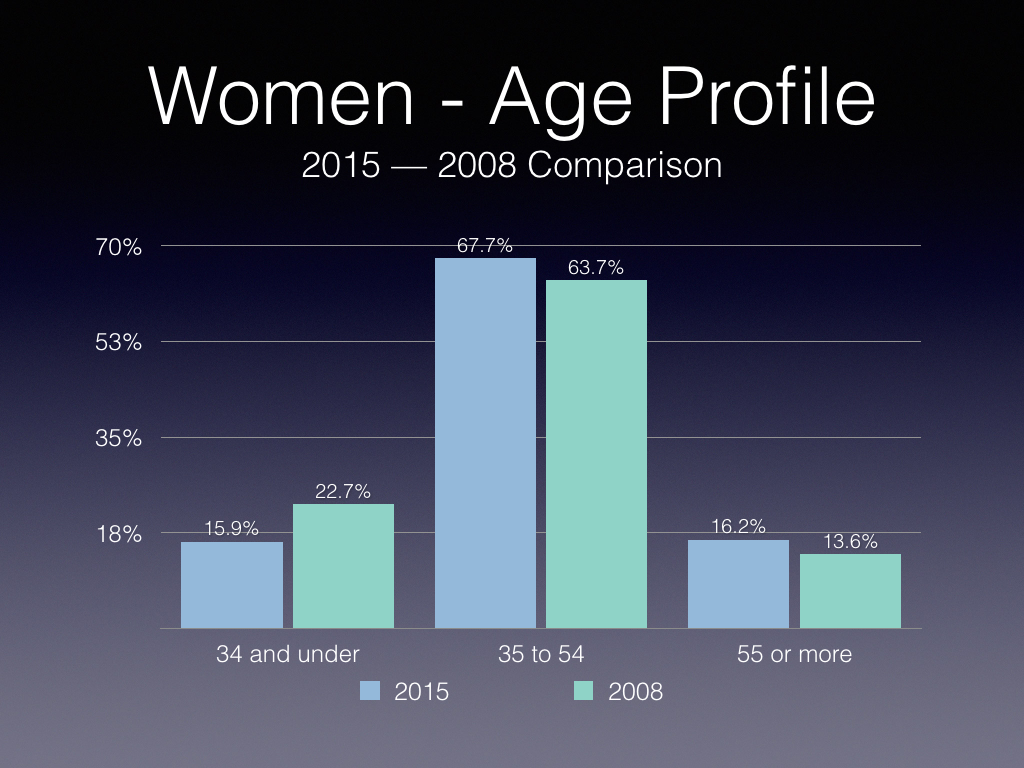
Looking at the age distribution of women in Chart 11, the proportion of main working-age women (35 to 54) and older women has increased while the proportion of younger women has decreased.
Part of this shift reflects the cuts in the numbers of public servants as a result of budget measures, which apply to all groups.
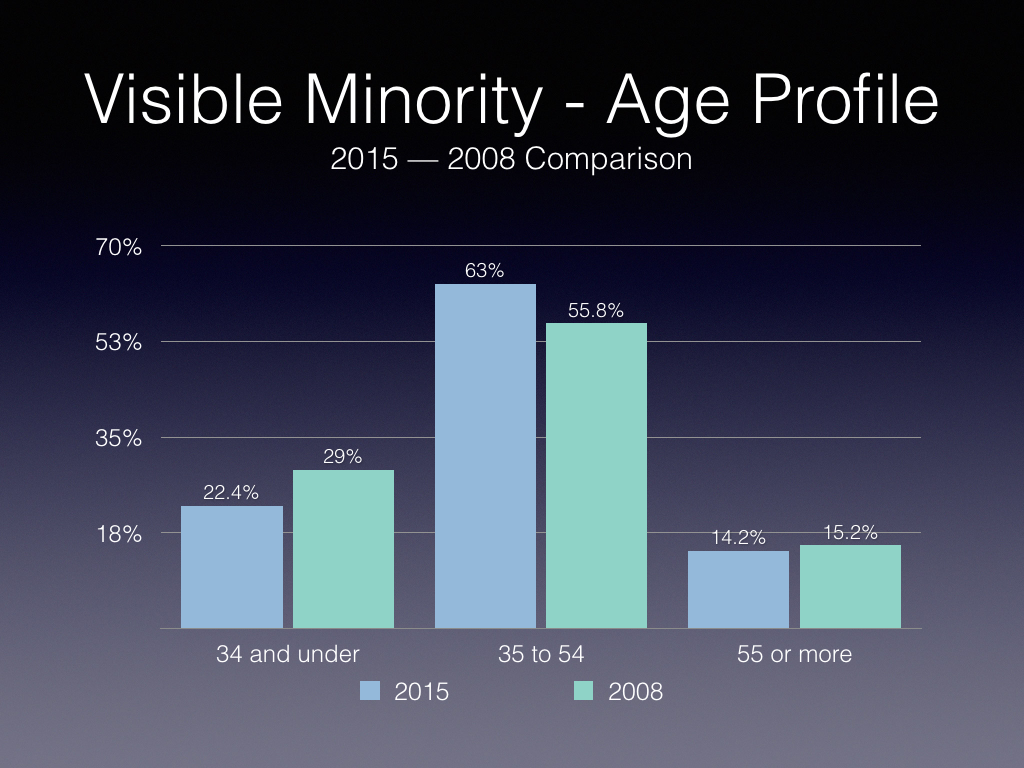
Looking at the age distribution of visible minorities in Chart 12, we see that while the overall trend is towards an aging workforce compared to 2008, it is still a relatively younger workforce compared to the labour market availability (13.0 percent) and representation (13.9 percent).
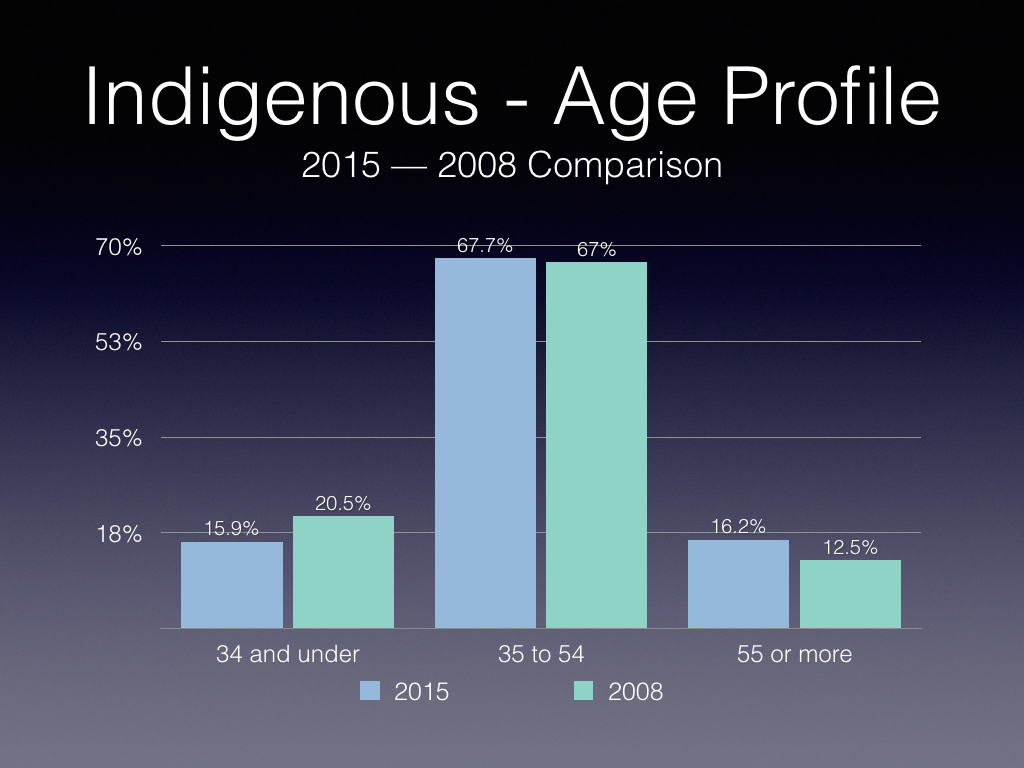
Looking at the age distribution of Indigenous people in the public service in Chart 13, the same general trend of an aging workforce appears.
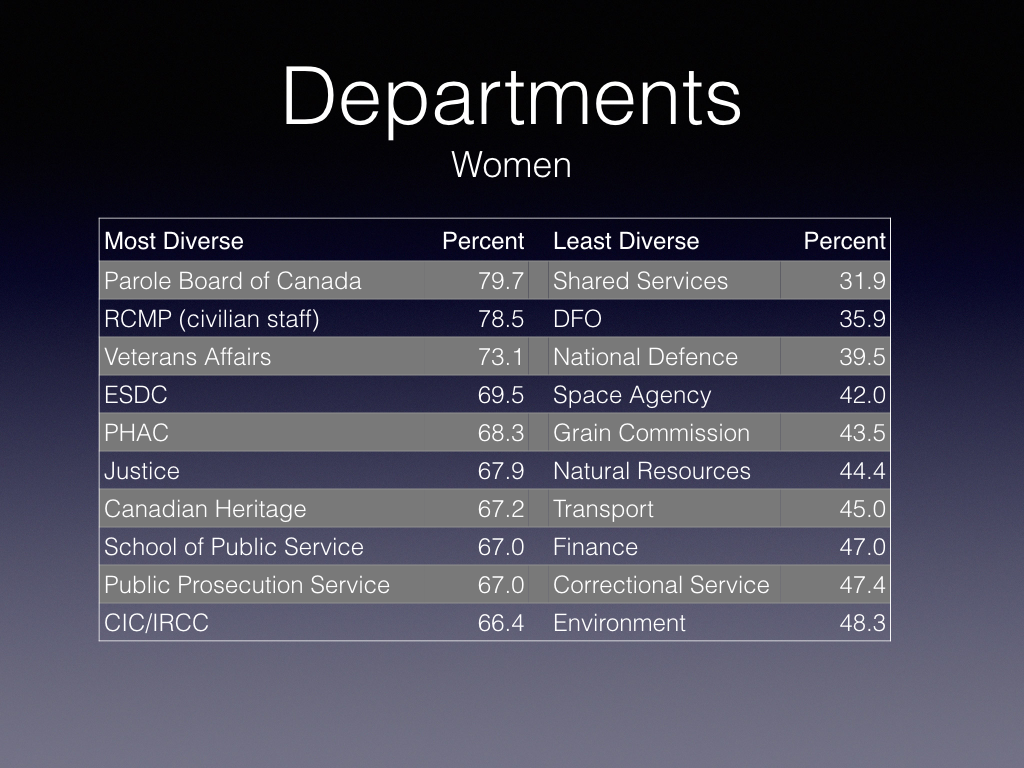
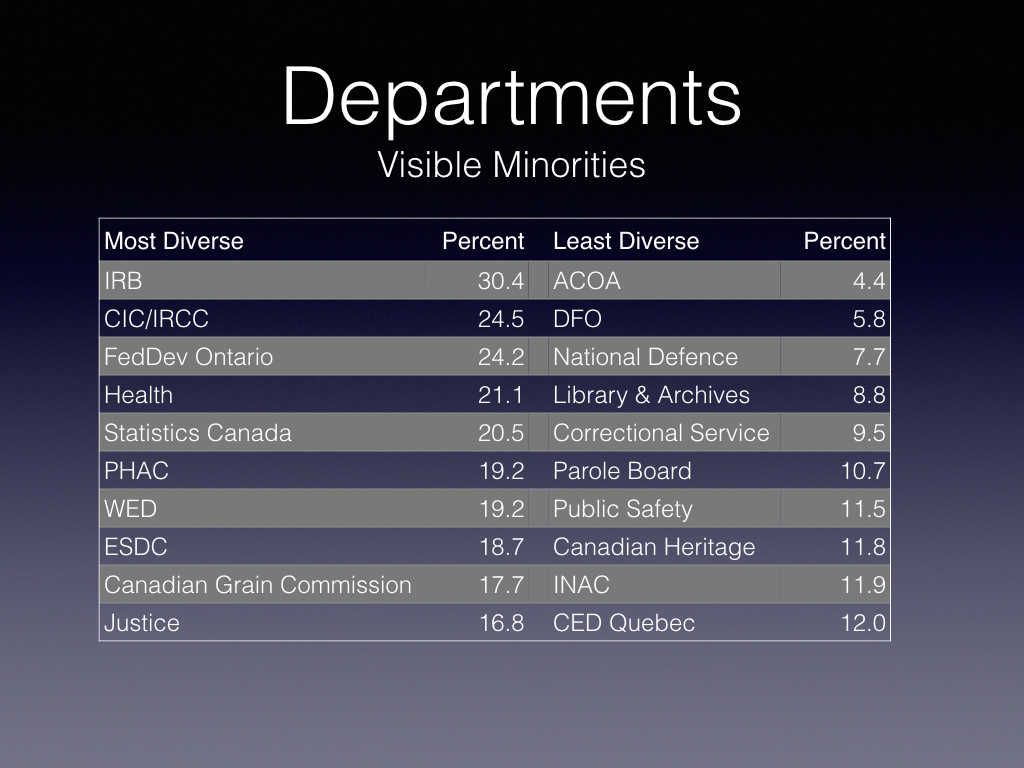
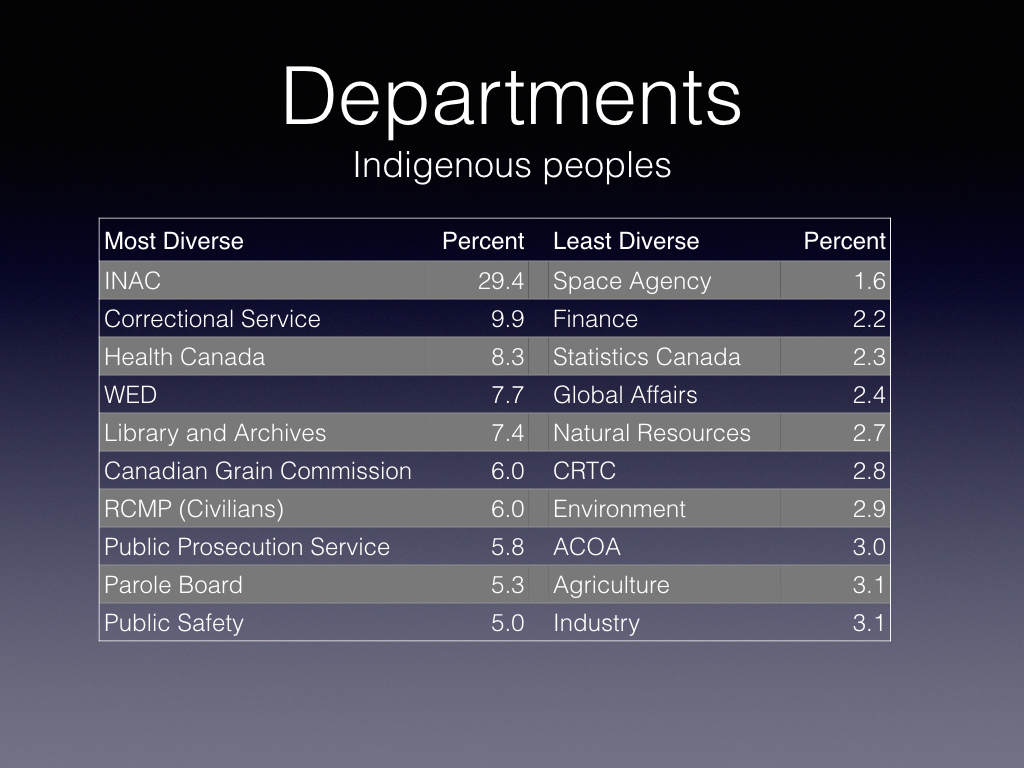
The following Tables 1, 2 and 3 look at the most and least diverse departments, including only those organizations with 250 employees or more, except the Administrative Tribunal Support Service of Canada.
Overall, employment equity and increased representation of women, visible minorities and Indigenous people can be considered a success story. While gaps remain, particularly at senior levels, the younger demographics of visible minorities, and the recent patterns of hirings, promotions and separations suggest that representation will continue to improve.
The government’s commitment to diversity and inclusion in appointments will likely impact upon the public service but the degree to which it will do so compared to the existing trends is unknown.
An additional issue for the public service is the need to improve reporting. If earlier reports were too detailed and long, the current approach of two pages and six data tables went too far in the other direction. Two aspects in particular have been lost: gender breakdowns for visible minorities, Indigenous people, and persons with disabilities, and no breakdown between permanent and term employees. The lack of historical data is another area that should be addressed.
Ironically, government employment equity reporting on the federally-regulated sectors (banking, telecommunications, transport) is much more complete than reporting on the public service. The Treasury Board Secretariat should review Labour Canada’s report as a possible model for future reporting.
Do you have something to say about the article you just read? Be part of the Policy Options discussion, and send in your own submission. Here is a link on how to do it. | Souhaitez-vous réagir à cet article ? Joignez-vous aux débats d’Options politiques et soumettez-nous votre texte en suivant ces directives.